

Introduction
Materials and Methods
Plant Materials and Sampling
Chemicals and Materials
Phenolic Compounds Extraction and Preparation
Determination of Total Phenolic Contents (TPCs)
Determination of Crude Fiber Content (CFC)
Determination of Dietary Fiber Content (DFC)
Determination of Crude Protein Content (CPC)
Determination of DPPH Radical-Scavenging Activity (DPPH-RSA)
Determination of Trolox Equivalent Antioxidant Capacity (TEAC)
Statistical Analysis
Results and Discussion
Plant Characteristics
Total Phenolic Content and Nutritional Composition
Antioxidant Activities
Correlation and Principal Component Analysis
Introduction
Pigeon pea (Cajanus cajan (L). Millsp; Fabaceae) is a perennial crop and the only cultivated Cajanus spp. known for drought resistance (Kassa et al., 2012; Rathinam et al., 2019). Recent archaeobotanical evidence has indicated that pigeon pea was originally domesticated in India (Fuller et al., 2019). However, the crop is ubiquitous in many tropical and subtropical regions, including Africa, Latin America, the Caribbean, and various parts of Asia (Kassa et al., 2012; Saxena et al., 2010). The plant has been used in traditional medicine to treat a variety of ailments, including coughs, measles, diabetes, and ischemic necrosis (Fuller et al., 2019; Wei et al., 2013a). Furthermore, a number of studies have also reported that the plant possesses anticancer, antidiabetic, and antimicrobial properties (Pal et al., 2011; Wei et al., 2013a; Zu et al., 2010).
For most people in many countries, pigeon pea is the main source of proteins and dietary minerals. In addition, the plant is known for its fiber, carbohydrate, and fat contents (Adenekan et al., 2018; Kaur et al., 2007; Oloyo, 2004; Saxena et al., 2010; Tekale et al., 2016), and legume proteins, in general, are recognized as sources of essential amino acids and as precursors of bioactive peptides with important physiological functions (Duranti, 2006). As such, pigeon pea seeds are increasingly used to augment the nutritive values of low- protein cereals (Akoja et al., 2017; Saxena et al., 2002; Torres et al., 2006). Legume-derived dietary fibers are also important components of food formulations and play major roles in the prevention of cardiovascular disease (Benítez et al., 2013).
In addition to dietary nutrients, pigeon pea has also been reported to contain a number of phenolic compounds with antioxidant properties (Liu et al., 2014; Nix et al., 2015; Wu et al., 2009). A variety of biochemical reactions in animal bodies generate reactive oxygen species (ROS) and reactive nitrogen species (RNS), and the overproduction of these radical species can degrade cellular components and, hence, cause a variety of physiological disorders and ailments (Jang and Park, 2018). In contrast, plant-derived phenolic compounds can neutralize ROS and RNS through a process known as radical scavenging (Nimse and Pal, 2015). Anthocyanins, isoflavones, and flavones are among the most important phenolic compounds reported from pigeon pea (Nix et al., 2015; Wei et al., 2013a;Wei et al., 2013b). For instance, cajanol is a specific isoflavone found in pigeon pea which has a promising anticancer property (Luo et al., 2010; Zhao et al., 2013). Furthermore, pinostrobin, vitexin, and orientin are known to be the species’ main flavonoid components (Liu et al., 2010; Wu et al., 2009).
Despite the health and nutritional benefits of pigeon pea, the crop remains underutilized. As the global population increases and food production is challenged by climate factors, orphan legume crops, such as pigeon pea, should be considered as important resources when developing future agricultural systems. As in other legumes (e.g., chickpea, lentil, and guar), there is growing interest in pigeon pea in the Republic of Korea (Choi et al., 2018). However, studies of pigeon pea germplasm collections grown in the Republic of Korea are lacking. Thus, to maximize the crop’s future use, utilization, and conservation, its morphological and biochemical properties must be fully evaluated. Accordingly, the aim of the present study was to evaluate the agricultural characters, phenolic and nutritional contents, and antioxidant capacities of seeds from 82 pigeon pea germplasm grown in the Republic of Korea. In addition to improving the crop’s utilization, the present study will provide a basis for the domestic adaptation of pigeon pea in future agricultural systems.
Materials and Methods
Plant Materials and Sampling
Seeds of 82 pigeon pea germplasm were obtained from the gene bank of the National Agrobiodiversity Center (http://genebank. rda.go.kr), Rural Development Administration, Republic of Korea, and were cultivated during the cropping season. More specifically, the seeds were sown in plug trays having 50 cells (one seed per cell) on April 4th, 2018, and after 23 d, they were planted in rows at spacing of 90 x 30 cm on an experimental field in Jeonju City. Agricultural characters related to growth habit, flower characters, pod characters, seed characters, and days to flowering and maturity were recorded from field observations during the growth period and laboratory experiments. Mature seeds were hand-harvested, oven-dried (25℃ for 3 d), pulverized, and stored at -20℃ for subsequent analysis.
Chemicals and Materials
Diatomaceous earth, ethanol, acetone, sulfuric acid and petroleum ether were purchased from Fisher Scientific (Pittsburgh, PA, USA). Gallic acid, Folin-Ciocalteu phenol reagent, L-ascorbic acid, diammonium salt of 2,2′-azino-bis (3-ethylbenzothiazoline- 6-sulfonic acid) (ABTS), 1,1-diphenyl-2-picrylhydrazyl radical (DPPH∙), 6-hydroxy-2,5,7,8-tetramethylchromane-2-carboxylic acid (Trolox), α-amylase, protease, and amyloglucosidase were purchased from Sigma-Aldrich (St. Louis, MO, USA). All reagents and chemicals used in the present study were of analytical grade, with ≥ 98% purity.
Phenolic Compounds Extraction and Preparation
Phenolic compounds extraction was achieved using Dionex accelerated solvent extractor-200 (Thermo Scientific, Waltham, MA, USA), which was equipped with a solvent reservoir, extraction cell, and collection vial, and a previously reported method (Assefa et al., 2018), with some modifications. Briefly, a circular cellulose filter (i.d. 19.88 ㎜) was placed at the bottom of each stainless-steel extraction cell, after which 7 g seed powder was placed between two layers of diatomaceous earth, and each extraction cell was tightly closed. Ethanol (75%) was used as an extraction solvent for 3 cycles of 15 min each under nitrogen at 1500 psi and 70℃. The extractants were collected in 50 mL conical plastic tubes and dried using a HT-4X vacuum concentrator (Genevac, Ipswich, UK) at 40℃. Dried extracts were stored at -20℃ and later used for the measurement of total phenolic contents (TPCs) and antioxidant activities.
Determination of Total Phenolic Contents (TPCs)
The TPCs of the dried seed extracts were determined using the Folin-Ciocalteu method (Assefa et al., 2018). Specifically, 100 µL of Folin-Ciocalteu reagent was added to 100 µL of sample extract (200 ppm in 75% ethanol). The mixture was allowed to react in the dark for 3 min at room temperature (~25℃), supplemented with 100 µL sodium carbonate (Na2CO3, 2%), and then incubated for an additional 30 min. Finally, the absorbance (λmax 750 ㎚) of the mixtures was evaluated using an Eon Microplate Spectrophotometer (Bio-Tek, Winooski, VT, USA) and 75% ethanol as a negative. Measurements were performed in triplicate and were expressed as gallic acid equivalent (㎎) per g dried sample extract (㎎ GAE g-1 DE).
Determination of Crude Fiber Content (CFC)
The CFCs of the seed extracts were measured using the methods of the AOAC (1990). Briefly, 0.7 g of pulverized seed samples sealed in filter bags and defatted in petroleum ether for 10 min, after which the solvent was poured off. The filter bags were then air-dried, and agitated in H2SO4 using a Fiber Analyzer (FOSS, Hillerod, Denmark) to extract crude fiber by eliminating non-fibrous components. After 40 min, the bags were removed, and then immersed in acetone for 10 min. The filter bags were then recovered, dried at 105℃ for 2 h, and cooled for 30 min in a desiccator. The filter bags were weighed, incinerated in an electric furnace (550℃ for 2 h), cooled for 40 min in a desiccator, and then re-weighed. Finally, percent crude fiber content was calculated as the loss in weight after incineration.
Determination of Dietary Fiber Content (DFC)
The DFC of the seeds samples were analyzed using Analytical Fibertec E-1023 System (FOSS, Hillerod, Denmark), as described previously (AOAC, 1990). Briefly, 1 g of each pulverized seed sample was individually suspended in 50 mL phosphate buffer (0.08 M), digested using α-amylase (0.1 mL), and incubated at 100℃ for 15 min. The samples were then subjected to successive digestion (i.e., hydrolysis) using protease and amyloglucosidase (0.1 mL each) at 60℃ for 30 min each, with proper pH adjustment between successive digestion steps. The mixtures were treated with four volumes of 95% ethanol, stirred, and then incubated overnight at room temperature (~25℃). The resulting precipitates were filtered through a crucible with Celite, successively washed with 78% ethanol, 95% ethanol, and pure acetone, dried at 60℃ overnight, and then weighed to determine percent DFC.
Determination of Crude Protein Content (CPC)
The CPCs of the seed samples were measured using the automatic Kjeldahl method (Horax et al., 2010) and protein digestion with an Auto-digester (FOSS, Hoganas, Sweden) that was preheated to 420℃. More specifically, 0.5 g of each pulverized seed sample was put into digestion tube and hydrolyzed using 12 mL concentrated H2SO4 and two selenium catalyst pellets for 1 h. The digestion tube was then removed, cooled to room temperature (~25℃), and processed using an automatic Kjeltec analyzer (FOSS, Hoganas, Sweden) that was capable of distillation and colorimetric titration. Finally, percent CPC was auto-computed as percent nitrogen content multiplied by 6.25 (standard Kjeldahl factor).
Determination of DPPH Radical-Scavenging Activity (DPPH-RSA)
The DPPH-RSAs of the seed extracts were measured following a previously reported procedure (Piao et al., 2013) with some modifications. Briefly, 100 µL of each sample extract (200 ppm, 75% ethanol) was individually mixed with 100 µL DPPH (150 µM), protected from sunlight, and incubated at room temperature. After 30 min, the absorbance (λmax 517 ㎚) of each sample was measured, and percent DPPH-RSA was calculated as follows:
| $$\left(1-\left(\frac{A_{Sample}-A_{Blank\;sample}}{A_{Control}-A_{Blank\;control}}\right)\times100\right)$$ | (1) |
where A represents absorbance. The values were calculated in triplicate and then compared with the DPPH-RSA of ascorbic acid and calculated as ascorbic acid equivalent (㎎) per g dried extract (㎎ AAE g-1 DE).
Determination of Trolox Equivalent Antioxidant Capacity (TEAC)
The TEACs of the sample extracts were evaluated using a previously reported method (Piao et al., 2013) with some modifications. Before analysis, a stock solution of ABTS radical was prepared in the dark by dissolving ABTS (7 mM) in potassium persulfate (K2S2O8,2.45 mM), incubating the mixture at room temperature (~25℃) for 16 h, and then diluting the mixture with water until reaching an absorbance (λmax 734 ㎚) of 0.700 ± 0.02. Then, 10 µL of each sample extract (200 ppm in 75% ethanol) was individually mixed with 150 µL of the ABTS radical stock solution, and incubated in the dark at room temperature. After 3 min, the absorbance (λmax 734 ㎚) of each sample was measured in triplicate. The percent ABTS-scavenging activity was calculated using equation (1) and compared to the ABTS-scavenging activity of Trolox and calculated as Trolox equivalent (㎎) per g dried extract (㎎ TE g-1 DE).
Statistical Analysis
All measurements were performed in triplicate, and data were expressed as mean ± standard deviation (SD) values. Measurements were compared using one-way analysis of variance (ANOVA), and p-values of <0.05 were considered statistically significant. Percent coefficient of variance (%CV) was used to evaluate the variability of the measured variables, and Pearson’s correlation coefficient was used to identify associations among the quantitative variables. Principal component analysis (PCA) was used to evaluate variations among accessions based on quantitative data files. All statistical analyses were conducted using XLSTAT ver. 2016 (Addinsoft, Long Island, NY, USA).
Results and Discussion
Plant Characteristics
The pigeon pea accessions exhibited erect and compact (24.39%), semi-spreading (74.39%), or spreading (1.22%) growth habits and determinate (89.02%), semi-determinate (2.44%), or indeterminate (8.54%) flowering patterns (Table 1). Most accessions produced yellow (93.9%), medium-streaked (90.24%), and red-accented (97.56%) flowers, and around half (52.44%) of the accessions produced flat pods, whereas the others (47.56%) produced cylindrical pods, which is the dominant form among pigeon pea accessions grown in India and Benin (Uphadhyaya et al., 2007; Zavinon et al., 2019). All accessions produced green and pubescent pods, and most accessions (95.12%) produced green stems. Seed shape was oval (3.66%), globular (18.29%), or square (78.05%), and most accessions produced seeds with orange (96.34%) and orange-accented (98.78%) coloration, usually with a plain pattern (95.12%; Table 1). Overall, the accessions exhibited considerable variation, as reported previously (Uphadhyaya et al., 2007; Zavinon et al., 2019).
Table 1. Summary of qualitative agricultural characters in 82 pigeon pea germplasms grown in the Republic of Korea
Variations were also observed in days to 50% flowering (D50F), duration of flowering (DoF), days to 75% maturity (D75M), seeds per pod, 100-seed weight, and yield per plant (YPP) (Table 2). D50F ranged from 64 (IT170382) to 116 d (IT170340), and most of the accessions could be considered early flowering when compared to previous reports (Kumara et al., 2013; Uphadhyaya et al., 2007). The duration of flowering ranged from 20 (IT170443) to 72 d (IT170306). Meanwhile, days to 75% maturity ranged from 30 (IT170350 and IT170340) to 72 d (IT170306). Seeds per pod ranged from 3.00 to 5.70, with a mean of 3.82, and the greatest 100-seed weight was 12.60 g (IT170366), whereas the lowest was 6.00 g (IT170383). Accession IT170419 exhibited the greatest yield per plant (148.60 g), whereas accession IT170379 exhibited the lowest (6.00 g). Finally, the %CV values ranged from 10.51% (seeds per pod) to 57.15% (yield per plant), thereby indicating a high degree of variation (Table 2). Overall, the observations of the present study were comparable to those of previous reports (Kumara et al., 2013; Uphadhyaya et al., 2007; Zavinon et al., 2019).
Table 2. Variation in the quantitative agricultural characters, phenolic and nutritional contents, and antioxidant activities of 82 pigeon pea accessions
Among all the agricultural characters evaluated in the present study, growth habit, flowering pattern, DoF, D75M, and YPP were considered most important, owing to their polymorphic nature and high variability (Tables 1 and 2). Legumes with erect and compact growth habits are usually preferred in agricultural systems since they are convenient for field management and large-scale harvest (Schlautman et al., 2018). Such cultivars are also less susceptible to pod rots, which are caused by contact between pods and the soil. In the present study, 20 accessions exhibited compact and erect growth habit, whereas 60 were semi-spreading, and a single accession (IT170419) exhibited a spreading growth habit. Meanwhile, 73 accessions exhibited determinate flowering patterns, whereas seven were indeterminate, and two (IT170350 and IT170356) were semi-determinate. Based on D75M, the determinate- flowering accessions matured earlier (July 26 to August 30, 2018) than indeterminate-flowering accessions (September 11–14, 2018). Overall, 14 accessions (IT170270, IT170276, IT170291, IT170290, IT170355, IT170449, IT170292, IT170312, IT170379, IT170386, IT170388, IT170418, IT170443, and IT170340) exhibited early maturity, compact and erect growth habits, and determinate flowering patterns, with the six (IT170379, IT170386, IT170388, IT170418, IT170443, and IT170) exhibiting above-average YPP values (Table 3).
Table 3. Phenolic and nutritional contents, antioxidant activities, and yield of selected early-maturing pigeon pea germplasms grown in the Republic of Korea
Total Phenolic Content and Nutritional Composition
The study accessions showed variation in the total phenolic (TPC), crude protein (CPC), crude fiber (CFC), and dietary fiber (DFC) contents. TPC ranged from 16.42 ± 0.62 (IT170346) to 29.67 ± 0.43 ㎎ GAE g-1 DE (IT170446), with a mean of 24.48 ± 3.11 ㎎ GAE g-1 DE (Table 2, Appendix 1), which is greater than the TPC previously reported for a Nigerian cultivar (22.8 µg/100 g; Oloyo, 2004) and two pigeon pea cultivars from India (4.8 and 13.5 ㎎/g; Singh, 1993). CPC ranged from 16.76 ± 6.74% (IT170286) to 22.61 ± 0.05% (IT170309), with a mean of 20.22% and with all values falling within the previously reported range for the mature seeds of commonly grown pigeon pea cultivars (15.5–26.8%; Salunkhe et al., 1986; Table 2). The CFC ranged from 4.70 ± 0.24 (IT170291) to 8.63 ± 0.02% (IT170355), with a mean of 6.83%, whereas DFC ranged from 12.98 ± 0.71 (IT170336) to 33.19 ± 1.50% (IT170444), with a mean of and 21.84%. Previous studies have reported CFCs as high as 8.30% (Oloyo, 2004) and ranging from 9.8 to 11.9 % in Botswana (Amarteifio et al., 2002). In general, the phenolic and nutritional contents of the study accessions from the Republic of Korea were comparable to those of pigeon pea seed samples grown in other countries. Among the 14 accessions that exhibited early maturity, determinate flowering, and compact and erect growth habits, only two accessions (IT170312 and IT170449) yielded below-average TPCs, and only IT170355, IT170449, and IT170443 failed to yield above-average CPCs. Furthermore, accessions IT170270, IT170291, IT170290, IT170355, IT170449, IT170292, and IT170312 yielded high DFCs (Table 3).
Antioxidant Activities
The antioxidant activity assays indicated that the pigeon pea accessions varied in their DPPH-RSA and TEAC. DPPH-RSA ranged from 1.61 ± 0.10 to 16.04 ± 2.30 ㎎ AAS g-1 DE, whereas TEAC ranged from 3.03 ± 0.86 to 42.24 ± 0.72 ㎎ TE g-1 DE (Table 2, Appendix 1), and accession IT170415 yielded the greatest values for both, whereas accessions IT170346 and IT170419 yielded the lowest DPPH-RSA and TEAC values, respectively. Differences in chemical composition and concentration may have contributed to the observed variation in antioxidant capacity (Pal et al., 2011). Among the 14 accessions that exhibited early maturity, determinate flowering, and compact and erect growth habits, only three (IT170312, IT170443, and IT170443) yielded below-average DPPH-RSAs, and IT170276, IT170290, IT170355, IT170379, IT170386, IT170418, and IT170443 yielded above-average TEACs (Table 3).
Correlation and Principal Component Analysis
Pearson correlation analysis showed ranges of associations between measured variables (Table 4). YPP was negatively correlated with D75M (r = -0.22) and DoF (r = -0.33) and positively correlated with D50F (r = 0.59) and SPP (r = 0.32), as previously reported (Upadhyaya et al., 2007). However, CPC was weakly correlated with TEAC (r = 0.05) and negatively correlated with DPPH-RSA (r = -0.09), and fiber contents were weakly correlated with antioxidant capacities (Table 4). TPC was positively correlated with both DPPH-RSA (r = 0.63) and TEAC (r = 0.29). Positive correlations between phenolic contents and antioxidant activities are important factors in cultivar utilization. However, previous studies have failed to identify correlations between the phenolic contents and antioxidant activities of some legumes and cereals (Djordjevic et al., 2011; Jin-wei et al., 2005; Othman et al., 2007). Thus, the findings of the present study suggest that phenolic contents were major contributors to the antioxidant activities of the pigeon pea accessions.
Table 4. Correlations among quantitative agricultural characters, phenolic and nutritional contents, and antioxidant activities of 82 pigeon pea germplasm grown in the Republic of Korea
n*Significant at p < 0.05 level.
The principal component analysis (PCA) indicated that five components explained 74.66% of the total variance among the accessions (Table 5), and that 42.53% could be attributed to the first two components alone. YPP, DoF, D75M, and D50F were the greatest contributors to PC1 scores, whereas DPPH-RSA, TPC, TEAC, and CPC were the greatest contributes to PC2 scores (Table 5). The PCA biplot also confirmed the positive correlations among TPC, DPPH-RSA, and TEAC, as well as the opposite trends of CPC and antioxidant activities along the PC2 axis, thereby confirming the variables’ negative or poor associations (Fig. 1).
Table 5. Quantitative variables and eigenvectors of principal components in 82 pigeon pea germplasms grown in the Republic of Korea
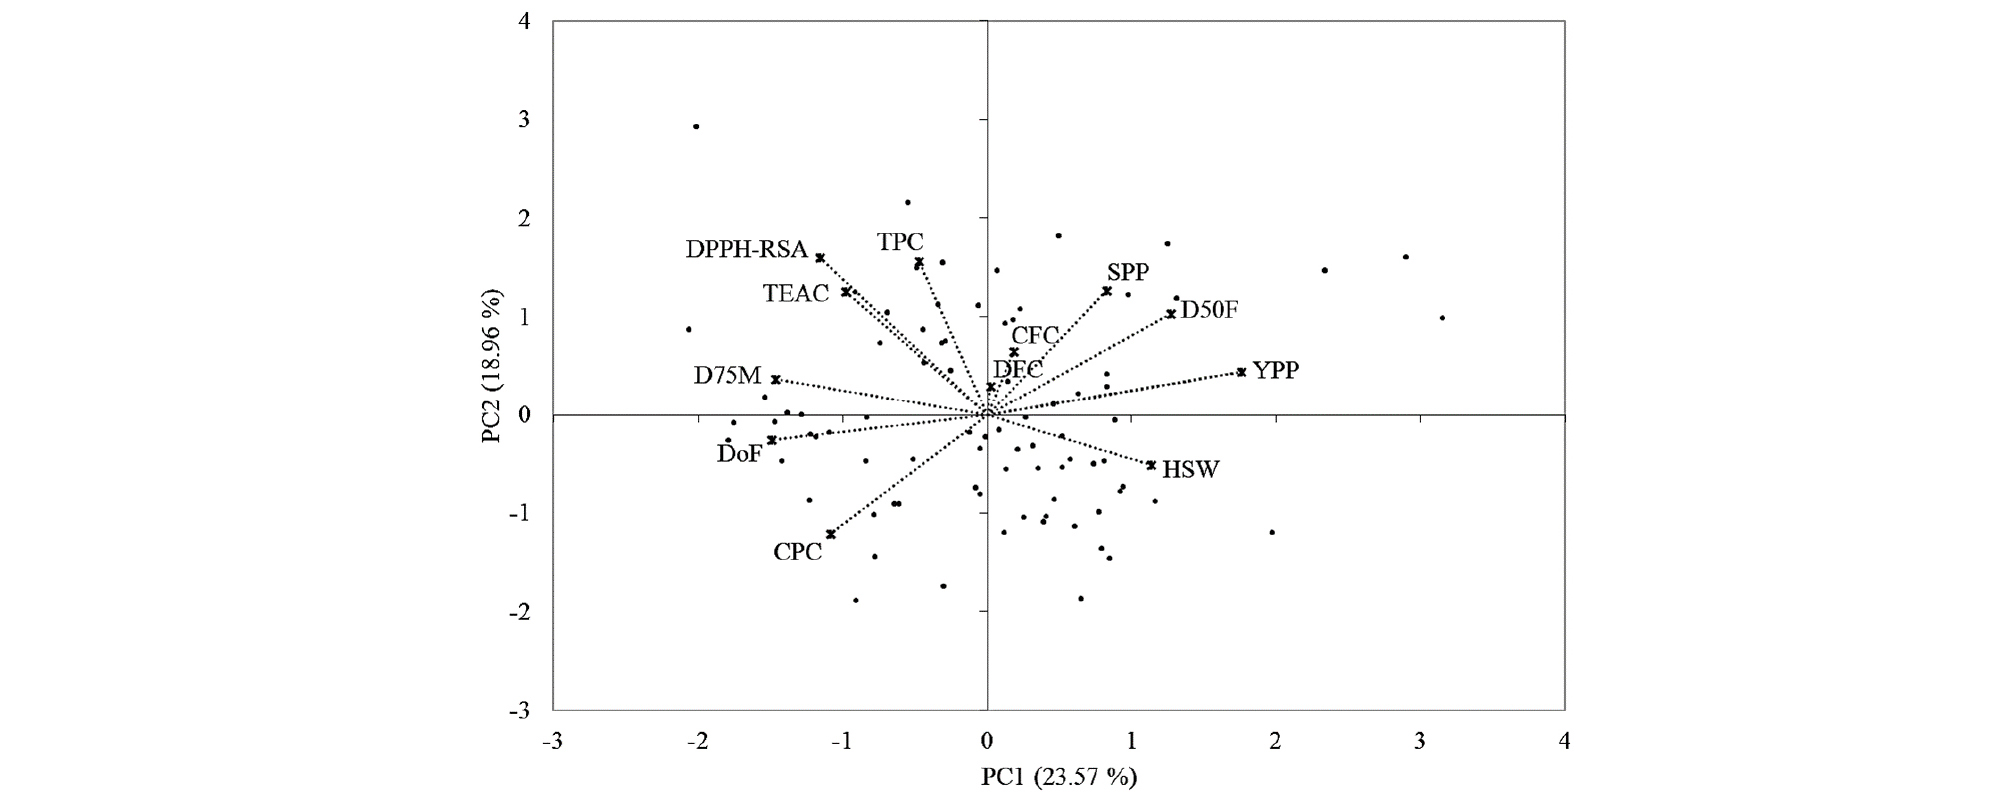
Fig. 1.
Principal components analysis bi-plot of quantitative variable data from 82 pigeon pea germplasms. The first two principal components accounted for 42.53% of the total variance. CFC: Crude fiber content; CPC: Crude protein content; DFC: Dietary fiber content; DoF: Duration of flowering; DPPH-RSA: DPPH radical-scavenging activity; D50F: Days to 50% flowering; D75M: Days to 75% maturity; HSW: 100-seed weight; SPP: Seeds per pod; TEAC: Trolox equivalent antioxidant capacity; TPC: Total phenolic content; YPP: Yield per plant.
In conclusion, the results of the present study indicated clear variation in the phenolic, crude protein, crude fiber, and dietary fiber contents of pigeon pea accessions grown in the Republic of Korea, as well as in their agricultural characters and antioxidant capacities. More specifically, IT170270, IT170276, IT170291, IT170290, IT170379, IT170386, IT170388, IT170418, and IT170340 are, here, considered excellent accessions, owing to their relatively high antioxidant activities and phenolic and protein contents. These accessions exhibited early maturity, determinate flowering, and compact and erect growth habits. In addition, accessions IT170270, IT170291, IT170290, and IT170392 yielded above-average DFC. Other accessions, including IT170355, IT170449, and IT170312 provided high DFCs, and accessions IT170291 and IT170290 are typically excellent, owing to their high YPP, DFC, CPC, TPC, and DPPH-RSA. The accessions considered as excellent could be useful cultivars to be adapted and grown in future agricultural systems of the Republic of Korea.
Appendix 1. Phenolic and nutritional contents and antioxidant activities of 82 pigeon pea accessions grown in the Republic of Korea
