

Introduction
Materials and Methods
Chemicals and reagents
Plant materials
Extraction of isoflavones
Identification and quantification of isoflavones
Statistical analysis
Results and Discussion
Plant properties and seed characters
Identification of isoflavones
Quantification of isoflavones
Comparison of isoflavone contents and seed coat colors
Comparison of isoflavone contents and days to maturity (DtM)
Principal component and correlation analysis
Introduction
Soybean (Glycine max (L.) Merrill) seeds are consumed worldwide owing to their nutritional values and health benefits. Several soybean seed products including milk, sprout, paste, and sauce are being used as protein sources for human diets (Miladinović et al., 2019; Park et al., 2018a; Yatsu et al., 2016). Besides, the application of soybean in pharmaceutical and cosmetic industries is growing (Chen et al., 2012). Due to these, studies that contribute to the improvement of soybean production and its health benefits are attracting researchers’ attention in recent years (Dubey et al., 2019; Miladinović et al., 2019).
Isoflavones are the major polyphenols that are ubiquitous in soybean seeds. Twelve isoflavones including daidzein, genistein, glycitein, daidzin, glycitin, genistin, malonyldaidzin, acetyldaidzin, malonylglycitin, acetylglycitin, malonylgenistin, and acetylgenistin are commonly found in soybean seeds. Structurally, daidzein, genistein, and glycitein are aglycones, and each form three common glycoside derivatives (Miladinović et al., 2019; Zhu et al., 2005). These isoflavones have different pharmacological properties including antioxidant, anti-inflammatory, anti-obesity, anti-diabetic and antiviral activities (Andres et al., 2009; Isanga and Zhang, 2008; Park et al., 2018b). Furthermore, studies indicated that regular consumption of soybean seeds reduces the risk of cancer and cardiovascular diseases (Mahmoud et al., 2014; Rimbach et al., 2008; Sarkar and Li, 2003; Watanabe et al., 2002). Isoflavone contents in soybean seeds are affected by both environmental and genetic factors. Several studies investigated the correlation of isoflavone contents with different environmental factors such as temperature, location, and growing conditions. Meanwhile, there are no surplus studies that assess the relationship between isoflavone contents and seed characters such as color, maturity period, size and weight (Bursać et al., 2017; Kim, et al., 2007a, 2012a; Maria-John et al., 2016; Sarkar and Li, 2003; Tepavčević et al., 2010).
Soybean seeds are found in different forms of seed coat colors including yellow, black, brown, reddish, and green. Moreover, bicolor varieties that have seed coats of two colors are common (Song et al., 2016). Previous studies presented inconsistent results about the relationship between isoflavone content and seed coat colors. For instance, Lee et al. (2010), Malenčić et al. (2012), and Akitha-Devi et al. (2018) found high total isoflavone content in yellow soybeans grown in Korea, central Europe, and India, respectively. In contrast, Bursać et al. (2017) and Kim et al. (2007b) observed high total isoflavone content in reddish, and black soybeans that were grown in Serbia, and Korea, respectively. These studies also presented varied contents of individual isoflavones among colored soybeans. Overall, there are no agreed remarks regarding the relationship between isoflavone contents and seed coat colors to date. The days to maturity is another agronomical character that influences the isoflavone contents in soybean seeds. For most soybean cultivars, the days to maturity ranges between 80 to 150 days. In their study, Zhang et al. (2014) found a higher total isoflavone content in late-maturing than early-maturing soybeans grown in China. Furthermore, Wang et al. (2000) found different contents of daidzin, glycitin, malonylglycitin, malonylgenistin, and acetylgenistin among different soybean maturity groups grown in the United States. Such correlation investigations are considered as valuable inputs when breeding improved soybean cultivars. Therefore, studies that assess the correlation between different seed characters and isoflavone contents are always desired (Dubey et al., 2019; Miladinović et al., 2019).
In Korea, there is a growing interest in increasing the cultivation of different soybean varieties. However, multidisciplinary researches that assist their production are still limited. Previously, the correlation between isoflavone contents and growing period, cultivation regions, growth conditions and seed weight were evaluated (Kim, et al., 2012a; 2014). To date, there are no excess studies that assess the correlation of isoflavone contents with seed coat colors and days to maturity in a large population of soybean germplasms grown in Korea (Cho et al., 2013; Lee et al., 2010). Hence, the aim of the present study was to assess the variations of 12 isoflavones in seeds of 49 soybean germplasms and determine if isoflavone compositions and contents associate with seed coat color and days to maturity. The results of this study could provide useful information to breeders for the selection of soybean cultivars with high isoflavone contents. Besides, the study will be helpful to disseminate soybean cultivars with high isoflavone content and boost their production in future agricultural systems.
Materials and Methods
Chemicals and reagents
Isoflavone standards including daidzein, genistein, glycitein, daidzin, genistin, and glycitin were purchased from Sigma Aldrich (St. Louis, MO, USA). Acetyldaidzin, acetylgenistin, acetylglycitin, malonyldaidzin, and malonylgenistin were purchased from Synthose (Ontario, Canada), and malonylglycitin from Fujifilm Wako Pure Chemical Corporation (Osaka, Japan). HPLC-grade water and methanol were purchased from Fisher Scientific (Pittsburgh, PA, USA), acetonitrile from Honeywell (Charlotte, NC, USA), and acetic acid from Merck (Darmstadt, Germany). All the chemicals and reagents were analytical grade and used without further purification.
Plant materials
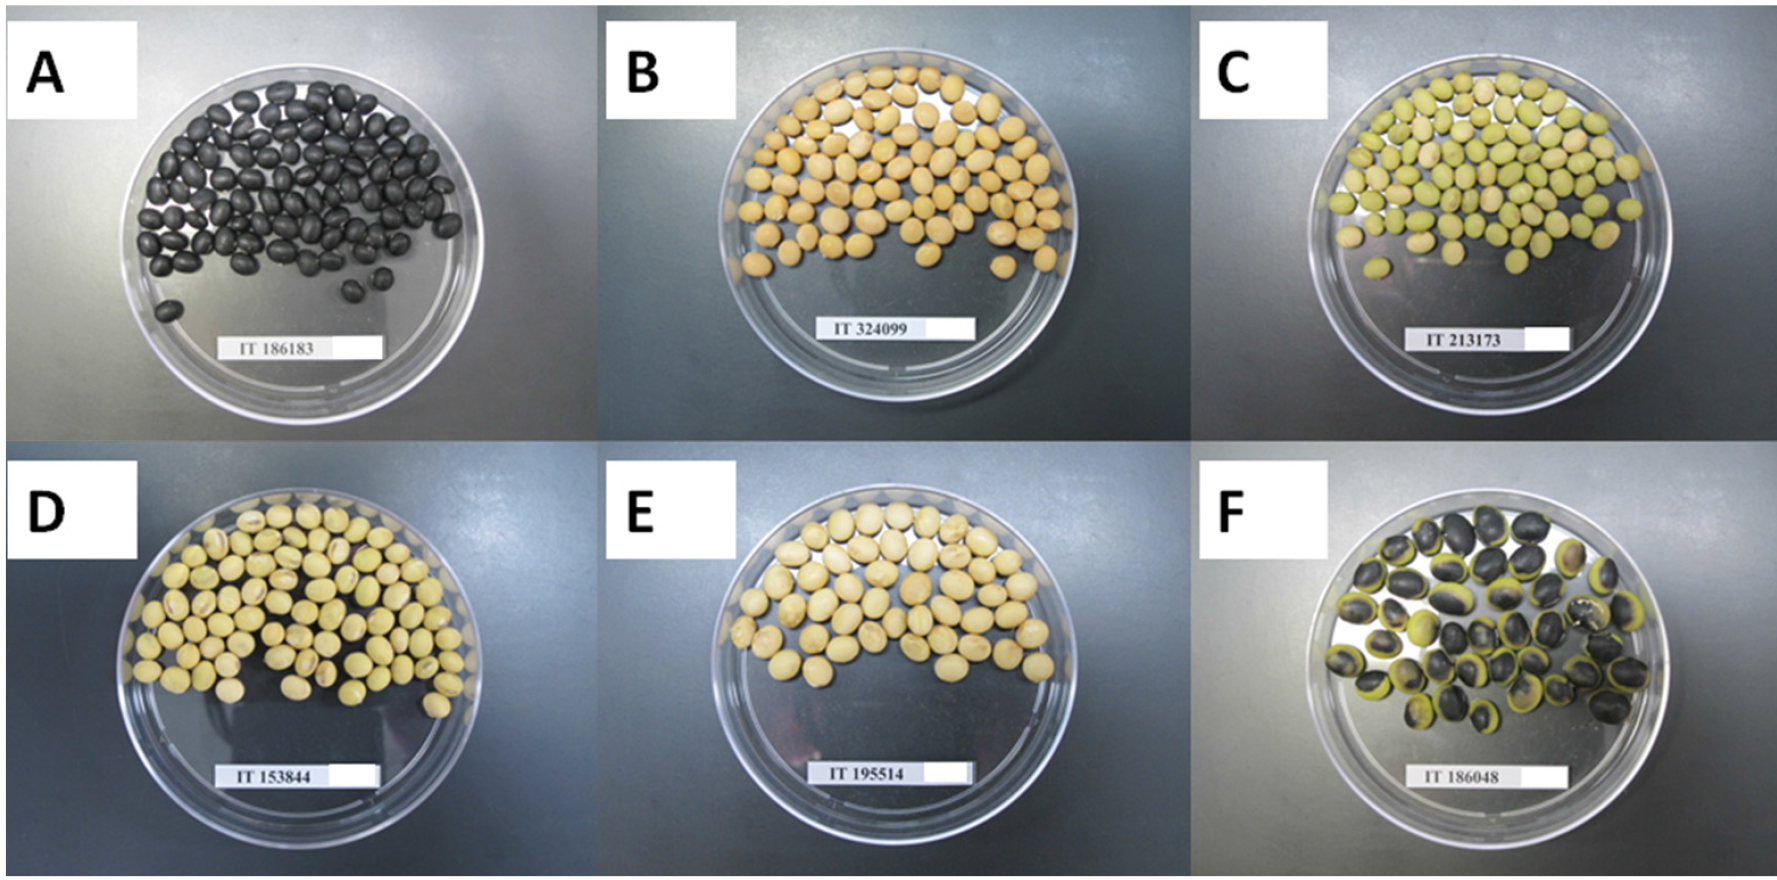
The seeds of 49 soybean germplasms with specific introduction (IT) numbers were obtained from the gene bank of the National Agrobiodiversity Center, Rural Development Administration, Republic of Korea. Seeds were directly sown in the experimental field, located in Jeonju City, in rows at a spacing of 90 x 15 cm on June 4th, 2019. A commonly grown soybean variety called cheonjakong-2-ho was also similarly cultivated and used as a control variety. Plant characters related to seeds and maturity were recorded during the growth period and from laboratory examinations. Mature seeds were hand-harvested and grouped as black, yellow, green, pale yellow, yellowish-green, and green with a black spot according to their seed coat colors, and as early, intermediate, and late-maturing based on their days to maturity relative to the control variety (Fig. 1). Whole seed samples were dried in Bionex Convection oven (Vision Scientific, Daejon, Korea) for three days at 50℃. Portions of each sample were pulverized, passed through a 315 μm sieve, and stored at -20℃ pending subsequent extraction.
Extraction of isoflavones
The extraction of isoflavone was conducted according to the method developed by Wu et al. (2017) with some modifications to the sample and solvent amount. Initially, 500 ㎎of powdered seed was added into a 15 mL extraction tube and mixed with 10 mL of 80% methanol. Then, the mixture was vortexed for 2 minutes followed by sonication in a water bath at 25℃ for 15 minutes. The mixture was then taken off and centrifuged at 4000 rpm for 10 minutes. The supernatant was collected, and the extraction cycle was repeated one more time for the residue. Approximately, 2 mL of the combined supernatant was pipetted, passed through a 0.45 μm PTFE syringe filter into an injection vial, and made ready for HPLC-analysis. All samples were analyzed within 72 hours after the extraction and stored at -20℃ when not used.
Identification and quantification of isoflavones
Identification and quantification of isoflavones were conducted using a 1260-Infinity Quaternary HPLC system equipped with an auto-sampler and coupled to a diode-array detector (DAD) (Agilent Technologies, Santa Clara, CA, USA). Isoflavones were identified by comparing the retention times of the corresponding external standards in RP-HPLC-DAD chromatograms. Calibration curves were plotted based on peak area responses of each standard at five concentration levels (80, 40, 20, 10, and 5 ㎎/L), and individual isoflavones were quantified from peak areas of the acquired chromatograms. The separation was achieved using an Inertsil ODS-3 (250 × 4.6 mm, 5 μm) column (GL Sciences, Tokyo, Japan) which was maintained at 30℃ throughout the analysis. A binary solvent system composed of water containing 0.1 % acetic acid (A) and acetonitrile (B) was used as mobile phase. The gradient elusion started with 18 % solvent B followed by an increase to 20 % for 20 minutes, and to 50 % for 39 minutes. Then, the final condition was maintained isocratic for one minute. The solvent flow rate was 1 mL/min, and the injection volume was 0.5 μL throughout the analysis. Isoflavones were detected at λmax 254 ㎚, and chromatograms were analyzed using Agilent ChemStation software (Agilent Technologies, Santa Clara, CA, USA).
Statistical analysis
All measurements were made in triplicate, and results were reported as mean ± standard deviation (SD) values. Treatments were compared using a one-way analysis of variance, and p < 0.05 was taken as statistically significant unless otherwise specified. The percent coefficient of variation (% CV) was used to determine the variability, and principal component analysis (PCA) was performed to evaluate the distribution of accessions based on isoflavone contents. Pearson’s correlation coefficient was used to find the pair-wise associations between the quantitative variables. All statistical analysis was computed using XLSTAT software version-2020.1 (Addinsoft, NY, USA).
Results and Discussion
Plant properties and seed characters
The soybean accessions showed different characters, and the recorded qualitative morphological traits and quantitative agronomical data are presented in Appendix 1 and Appendix 2, respectively. The soybean accessions were grouped according to their seed coat colors as black (24 accessions), yellow (10 accessions), green (2 accessions), yellowish-green (5 accessions), pale yellow (4 accessions), and green with black spot (4 accessions) (Fig. 1). Moreover, the days to maturity (DtM) was recorded as the number of days spanning from the sowing date to maturity date and ranged from 104 to 157 days. The commonly grown control variety, cheonjakong-2-ho, took 125 days to mature, and the 49 soybeans were grouped relative to it as early (104-123 days), intermediate (124-143 days), and late (> 144 days) maturing accessions. Accordingly, a total of 11, 31, and 7 accessions matured early, intermediate, and late, respectively. The average DtM was 112 days for early, 134 days for intermediate, and 149 days for late-maturing accessions. About 75.5% of the soybean accessions took longer days to mature than the control variety. In general, the days taken by the soybean accessions to mature were in agreement with earlier observations. For instance, Cho et al. (2013) found days to maturity that ranged between 85 and 156 days for soybeans grown in Korea. Comparably, Lee et al. (2020) recently reported days to maturity that ranged between 115 and 146 days for black soybean varieties. Studies found that such variations could arise due to differences in cultivation season, location, and genotype (Langewisch et al., 2017).
Appendix 1.
Quantitative morphological characters of 49 soybean accessions grown in Korea
Appendix 2.
Frequency (f) and percentage (%) distribution of qualitative morphological characters in 49 soybean accessions grown in Korea
Identification of isoflavones
In the present study, the compositions and contents of 12 isoflavones including daidzein, glycitein, genistein, daidzin, glycitin, genistin, malonyldaidzin, malonylglycitin, malonylgenistin, acetyldaidzin, acetylglycitin, and acetylgenistin were determined in the whole seeds of the 49 soybean accessions. The representative HPLC-DAD chromatograms and structures of the 12 isoflavones are shown in Appendix 3. The accessions showed variations in isoflavone compositions. Out of the 12 isoflavones, 11 were found in 2 accessions including S41(IT274592) and S42(IT275005). These accessions presented all isoflavones except malonylglycitin (Appendix 4). Furthermore, 9 isoflavones were detected in 18 accessions, 8 isoflavones in 11 accessions, and 7 isoflavones in another 11 accessions. Besides, the smallest number of detected isoflavone was 6 and found in 7 accessions including S8(IT154724), S9(IT155963), S12(IT177271), S13(IT177573), S14(IT177709), S24(IT228822), and S32(IT252748). Eight isoflavones including daidzin, glycitin, genistin, malonyldaidzin, malonylgenistin, genistein, daidzein, and acetylgenistin were detected in the control variety. Among these, the former six were detected in every soybean accession except in S31(IT252748) where glycitin was not detected. In contrast, acetylglycitin and glycitein were the less distributed isoflavones. Acetylglycitin was detected only in accessions S33(IT263155), S41(IT274592), and S42(IT275005) while glycitein was detected in S41(IT274592), S42(IT275005), and S43(IT308619). Earlier studies also noted differences in isoflavone distributions among soybean cultivars and revealed that such variations could arise due to differences in genotype and environmental factors (Bursać et al., 2017; Langewisch et al., 2017; Miladinović et al., 2019; Tepavčević et al., 2010).
Appendix 3.
HPLC chromatograms of standard isoflavone mixture (A) and a representative sample (B), and chemical structures of the 12 isoflavones analyzed (C)

Appendix 4.
Individual and total isoflavone composition and contents in seeds of 49 soybean germplasms with different seed coat colors grown in Korea
zSD: Standard deviation; yCV: Coefficient of variance; xSCC: Seed coat color; wDZG: Daidzin; vGLG: Glycitin; uGEG: Genistin; tADZG: Acetyldaidzin; sAGLG: Acetylglycitin; rMDZG: Malonyldaidzin; qMGLG: Malonylglycitin; pDZ: Daidzein; oAGEG: Acetylgenistin; nGL: Glycitein; mMGEG: Malonylgenistin; lGE: Genistein; kTIC: Total isoflavone content; jND: Not detected.
Quantification of isoflavones
The 12 isoflavones in the whole seeds of the 49 soybean accessions were quantified from peak area responses of the corresponding external standards. The total isoflavone content (TIC) in an accession was determined as the sum of all the detected individual isoflavones. The soybean accessions showed significant variations (p < 0.05) in both total and individual isoflavone contents (Appendix 4). With a mean of 3.428 ㎎/g, the total isoflavone content (TIC) ranged from 1.827 ㎎/g in accession S37(IT269982) to 5.777 ㎎/g in accession S15(IT178054). Approximately, 46.9% of the soybean accessions had higher TIC than the average. Moreover, 34.7% of the accessions presented higher TIC than the TIC in the control variety (3.701 ± 0.012 ㎎/g). Previously, Wu et al. (2017) reported a TIC that ranged from 2.276 to 7.258 ㎎/g in Chinese soybeans while Kim et al. (2012a) reported a TIC that ranged from 682.4 to 4777.81 µg/g (equivalent to 0.682 to 4.778 ㎎/g) in Korean soybeans. Furthermore, Xu and Chang (2008) investigated 30 soybean varieties grown in the US and found a TIC that ranged from 1.182 to 2.863 ㎎/g. Such content variations could arise due to the difference in cultivars, growing conditions, and extraction protocols. The average total aglycone, acetylglycoside, malonylglycoside, and glycoside contents were also analyzed and found to be 0.209, 0.090, 2.626, and 0.509 ㎎/g, respectively. The total malonylglycoside content was high (> 68%) in all accessions followed by total glycoside content, and the result was consistent with several earlier investigations (Azam et al., 2020; Kim et al., 2005; Lee et al., 2010; Tepavčević et al., 2010). Studies showed that the abundance of the enzymes uridine diphosphate-dependent glycosyltransferase and malonyl-Co-A dependent acyltransferase presumably contribute to the high accumulation of malonylglycoside and glycoside isoflavones (Ahmad et al., 2017).
Among the common six isoflavones, the largest variation was observed in daidzin content (60.99%) followed by glycitin (35.76%), and genistin (33.41%) contents. Meanwhile, the smallest variation was observed in genistein content (3.38%). The content of malonylgenistin was the highest while the content of acetylgenistin was the lowest in every accession where detected. This finding was analogous with a previous study by Kim et al. (2012a, 2012b), Xu and Chang (2008), and Lee et al. (2010) who also observed high content of malonylgenistin. Unlike the present finding, however, Kim et al. (2012b) presented glycitein as the lowest concentration. In other studies, high contents of malonyldaidzin (Bursac et al., 2017) and daidzin (Wu et al., 2017) were also reported. Generally, the isoflavone contents observed in the present study were consistent with previous findings. Accessions S15(IT178054), S40(IT274571), S27(IT231360), and S39(IT274515) could be considered as essential cultivars due to their high isoflavone contents. Furthermore, accessions S41(IT274592) and S42(IT275005) could be typically important owing to the presence of diverse isoflavones in their seeds.
Comparison of isoflavone contents and seed coat colors
The soybean accessions were grouped according to their seed coat colors, and the variations of isoflavone contents were assessed (Table 1). The TIC in black, yellow, green, yellowish-green, pale yellow, and green with black spot soybeans was in the ranges 2.110 ~ 5.777, 2.487 ~ 4.733, 2.185 ~ 4.413, 2.681 ~ 4.065, 1.827 ~ 4.085, and 3.376 ~ 4.133 ㎎/g, respectively. The average TIC was the highest in green with black spot soybeans (3.616 ㎎/g) followed by black (3.480 ㎎/g), yellow (3.449 ㎎/g), and yellowish-green (3.432 ㎎/g) soybeans. However, the average TIC in the later three soybeans was not significantly different (p > 0.05). Besides, the average TIC was the lowest in pale yellow soybeans (2.875 ㎎/g). Previously, high TIC was reported in seeds of other colored soybean varieties. For instance, Bursac et al. (2017) studied 20 soybean varieties of different seed coat colors and found an average TIC of 5.24 ㎎/g in yellow, 2.42 ㎎/g in green, and 2.76 ㎎/g in black soybeans. In another study, a TIC as high as 3.58 ㎎/g, 3.62 ㎎/g, and 3.39 ㎎/g was reported in black, yellow, and green soybeans, respectively although the isoflavones were quantified in terms of the aglycone concentrations (Malenčić et al., 2012). Besides, Wu et al. (2017) exclusively investigated black soybeans and found an average TIC of 4.182 ㎎/g. Compared to these studies, Lee et al. (2010) found a much lower average TIC in black (~ 0.704 ㎎/g), green (~ 0.804 ㎎/g), and yellow (~ 0.863 ㎎/g) soybeans grown in Korea. These observations signified that the reported isoflavone contents in soybeans of different seed coat colors were inconsistent and wide-ranging. Again, differences in cultivars, growing seasons, and analysis protocols could cause such content variations. In general, the average TIC observed in green with black spot soybeans in the present study was higher than the average TIC observed in black and brown soybeans reported by Lee et al. (2010) and Bursac et al. (2017) but lower than the average TIC observed in black and yellow soybeans reported by Wu et al. (2017) and Bursac et al. (2017), respectively.
The content of individual isoflavones also varied greatly among the colored soybean groups (Table 1). The average genistin (0.284 ㎎/g) and acetylgenistin (0.097 ㎎/g) contents were highest in green with black spot soybeans. Likewise, the average daidzin (0.224 ㎎/g), glycitin (0.110 ㎎/g), and malonyldaidzin (0.703 ㎎/g) contents were highest in yellow soybeans. This was consistent with the finding by Lee et al. (2010) and Bursac et al. (2017) who also observed high contents of daidzin and malonyldaidzin in yellow soybeans. Pale yellow soybeans displayed the lowest contents of all the commonly detected isoflavones except in genistein content (Table 1). On the other hand, the average malonylglycitin (0.386 ㎎/g) and daidzein (0.121㎎/g) contents were the highest in black soybeans. Previously, high content of malonylglycitin was observed in green and yellow soybeans (Cho et al., 2013; Lee et al., 2010). The highest total malonylglycoside content was found in green with black spot soybean (2.791 ㎎/g). Again, pale yellow accessions showed the lowest total malonylglycoside content (2.191 ㎎/g). It was depicted that environmental factors and genotype highly influence the contents of isoflavones in soybean varieties that differ in seed coat colors (Akitha-Devi et al., 2018; Cho et al., 2013; Lee et al., 2010).
Table 1.
Variation of isoflavone contents (㎎/g) in seeds of 49 soybean accessions with different seed coat colors grown in Korea
zCV: Coefficient of variance; ySD: Standard deviation; xDM: Days to maturity (in days); wDZG: Daidzin; vGLG: Glycitin; uGEG: Genistin; tADZG: Acetyldaidzin; sAGLG: Acetylglycitin; rMDZG: Malonyldaidzin; qMGLG: Malonylglycitin; pDZ: Daidzein; oAGEG: Acetylgenistin; nGL: Glycitein; mMGEG: Malonylgenistin; lGE: Genistein; kTIC: Total isoflavone content; jDetected only in one accession. iND: Not detected.
Comparison of isoflavone contents and days to maturity (DtM)
The DtM is an important agronomical character that highly influences the isoflavone contents in soybean seeds. Recently, Meladinovic et al. (2019) used soybean cultivars with different DtM for cross-breeding to develop genotypes with increased isoflavone content in aglycone form. In the present study, the soybean accessions were grouped as early, intermediate, and late-maturing based on the days to maturity, and the individual and total isoflavone contents were analyzed. Glycitein and acetylglycitin were not detected in any of the early and late-maturing accessions while acetyldaidzin was not detected in late-maturing accessions. Box plots were plotted for the TIC and the commonly detected individual isoflavones to view the variation in early, intermediate, and late-maturing soybeans (Figs. 2, and 3). The TIC in early, intermediate, and late-maturing accession was in the ranges 1.827 ~ 4.203, 2.269 ~ 4.733, and 2.681 ~ 5.777 ㎎/g, respectively (Fig. 2). Among the commonly detected individual isoflavones, the average genistin, malonylglycitin, and malonylgenistin contents were 0.263, 0.280, and 2.015 ㎎/g in late-maturing accessions, and 0.217, 0.200, and 1.473 ㎎/g in early maturing accessions, respectively (Fig. 3). The average malonyldaidzin content was exclusively higher in intermediate- maturing accessions. Overall, late and intermediate-maturing accessions presented a relatively high average TIC than early-maturing accessions although the variations are not significant (p > 0.05). Related studies conducted by Wang et al. (2000), Seguin et al. (2004), and Zhang et al. (2014) also found relatively higher TIC in late-maturing soybeans as described before. In another study, Ribeiro et al. (2007) found varied isoflavone ranges between different maturity groups but failed to observe significant content variations. In general, these studies indicated that longer growing time could affect the isoflavone accumulation patterns and hence, contribute to high isoflavone contents in late-maturing soybeans. However, the actual biological pathway is yet to be investigated.
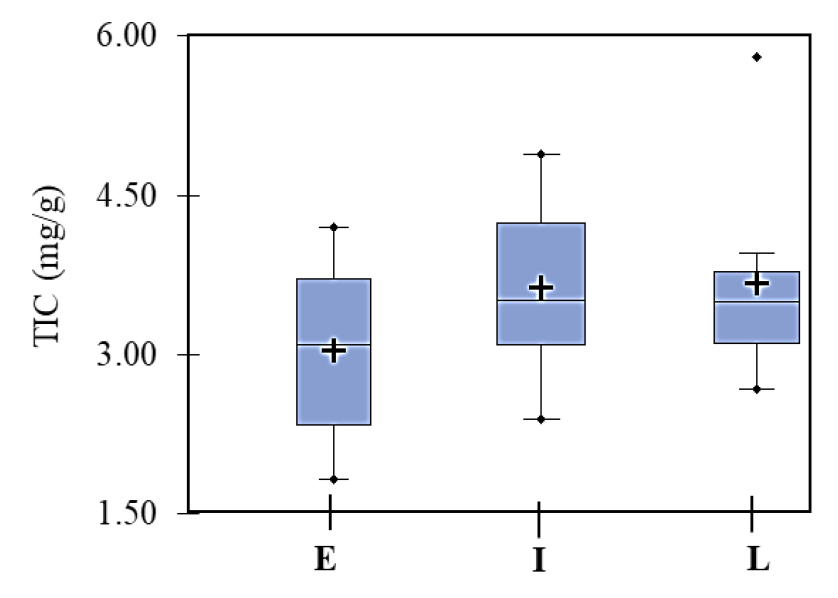
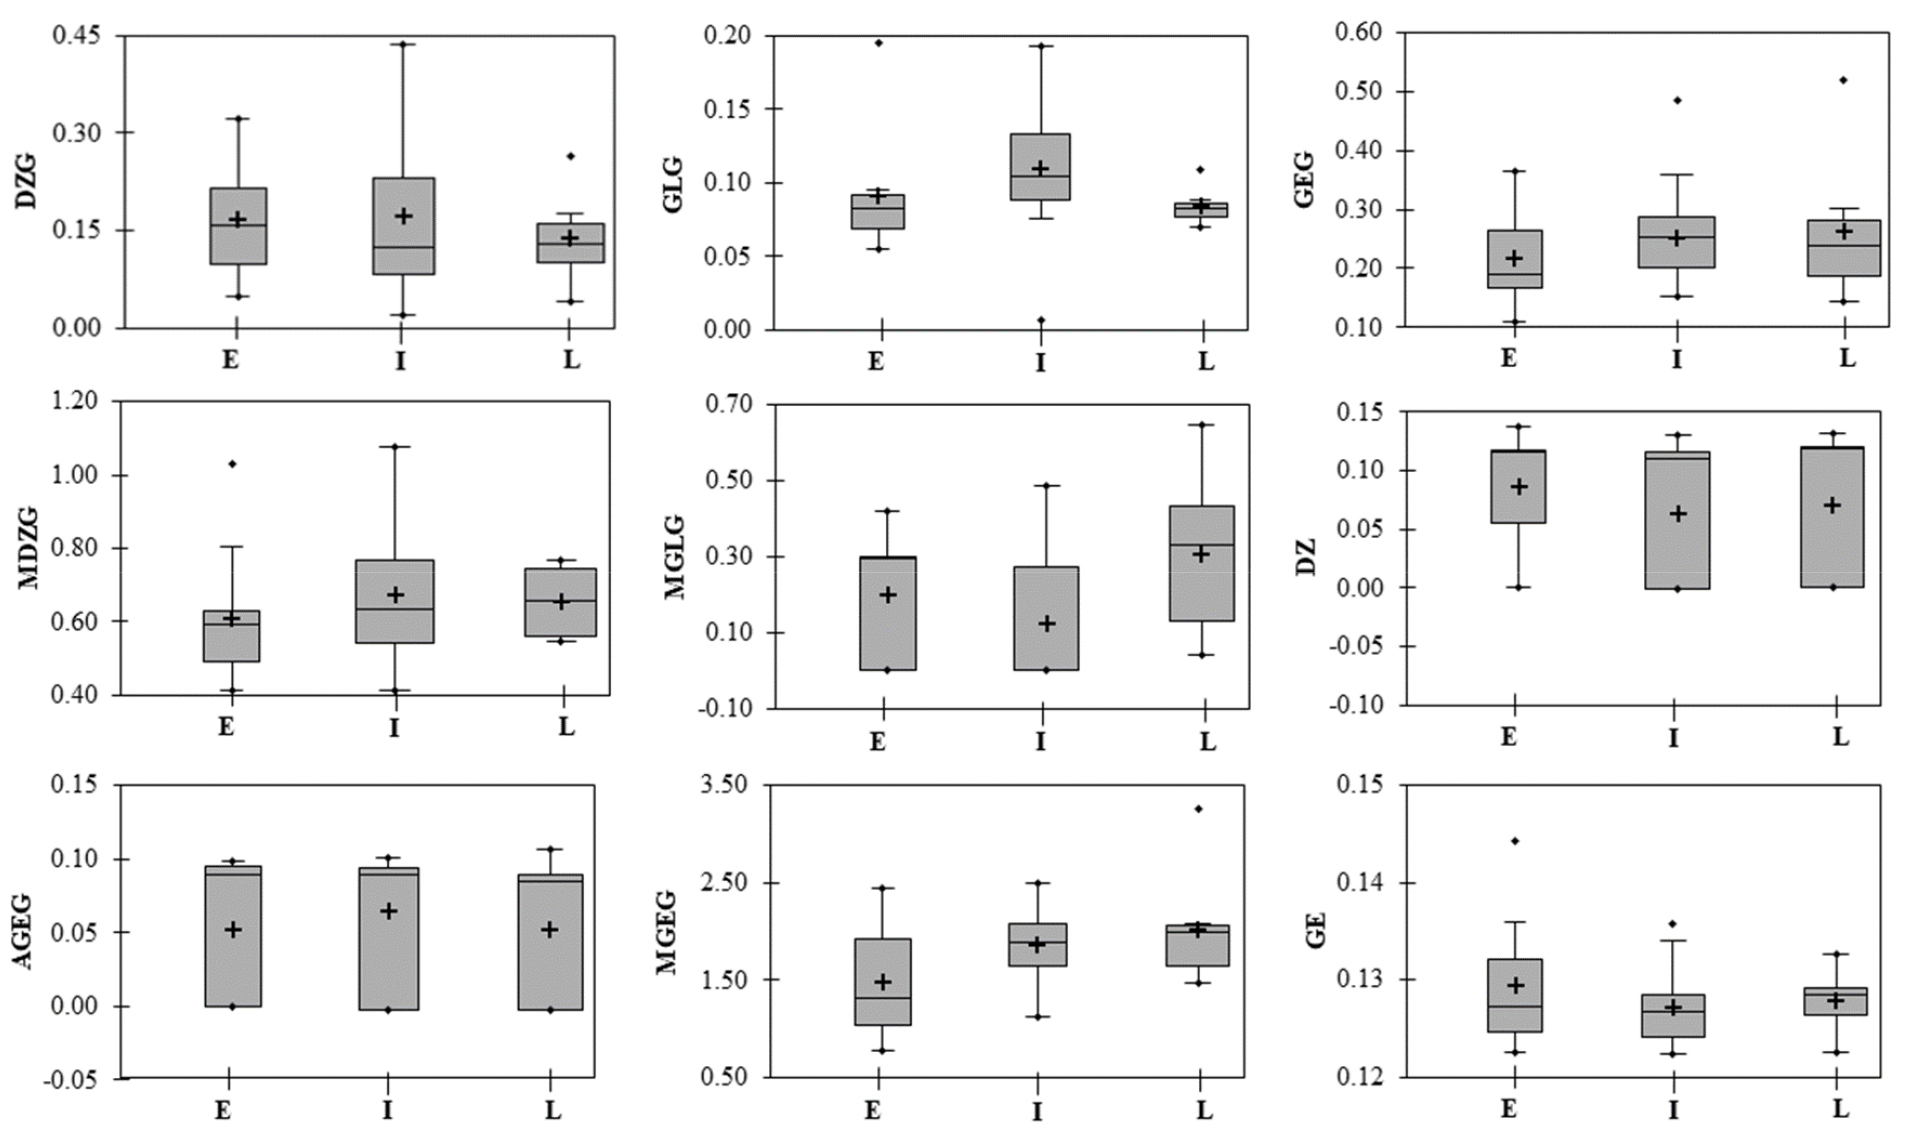
Fig. 3
Variability of the contents (㎎/g) of nine commonly found individual isoflavones in early (E), intermediate (I), and late (L) maturing soybeans. AGEG: Acetylgenistin; DZ: Daidzein; DZG: Daidzin; GE: Genistein; GEG: Genistin; GLG: Glycitin; MDZG: Malonyldaidzin; MGEG: Malonylgenistin; MGLG: Malonylglycitin. The lines across the box plot indicate the medians and crosses indicate mean values.
Principal component and correlation analysis
Principal component analysis (PCA) was performed to further view the association of the 49 soybean accessions over the contents of the 12 isoflavones. The first four components had eigenvalues > 1 and explained 74.51% of the total variance (Table 2). Out of these, the first two components (PC1 and PC2) accounted for 53.83% (Fig. 4). Accessions that contained high TIC and diverse isoflavones were clearly outlined along PC1 and PC2 axes, respectively. Accessions that contained high TIC (> 4.000 ㎎/g) including S1(IT21665), S5(IT143347), S6(IT153844), S15(IT178054), S21(IT213173), S27(IT231360), S39(IT274515), and S40(IT274571) were extended along the right side while accessions that contained low TIC (< 2.900 ㎎/g) including S23(IT224192), S24(IT228822), S25(IT229418), S31(IT252748), and S37 (IT269982) on the left side of PC1 axis in the scatter plot. Malonyldaidzin (16.94%), malonylgenistin (14.45%), daidzin (14.01%), and genistin (13.28%) were the principal contributors to the variation observed along PC1. Moreover, accessions S41(IT274592) and S42 (IT275005) that contained the most diverse isoflavones were clearly outlined on the top side along the PC2 axis. Likewise, glycitin (25.75%), acetylglycitin (25.63%), acetyldaidzin (15.82%), and malonylglycitin (8.91%) were the principal contributors to the variation observed along PC2 (Fig. 4A and B). In general, the PCA indicated that the difference among the soybean accessions resulted due to the variation in both isoflavone composition and content.
Table 2.
Variability and eigenvalues of the first five components obtained from principal component analysis of the 49 soybean accessions over individual and total isoflavone contents
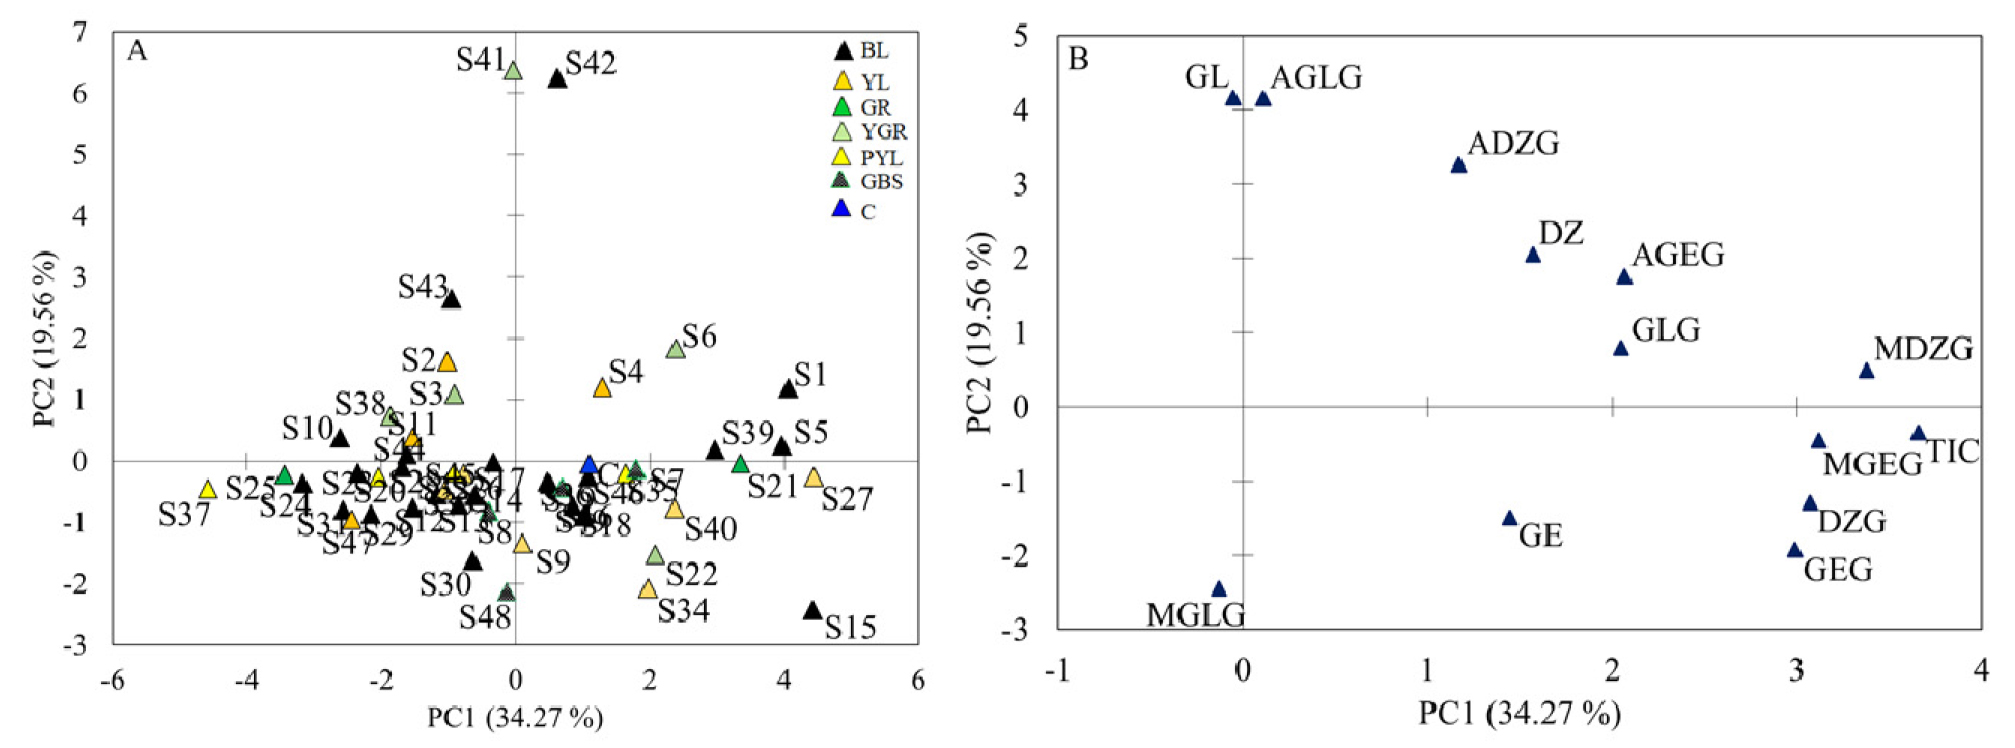
Fig. 4
Scatter plot (A) of the 49 soybean accessions and loading plot (B) of the isoflavones obtained from the first two principal components. ADZG: Acetyldaidzin; AGEG: Acetylgenistin; AGLG: Acetylglycitin; BL: Black; C: Control; DZ: Daidzein; DZG: Daidzin; GBS: Green with black spot; GE: Genistein; GEG: Genistin; GL: Glycitein; GLG: Glycitin; GR: Green; MDZG: Malonyldaidzin; MGEG: Malonylgenistin; MGLG: Malonylglycitin; PYL: Pale yellow; TIC: Total isoflavone content; YL: Yellow; YGR: Yellowish green.
Pearson’s correlation analysis was conducted to determine the relationship between quantitative variables. A significant and positive correlation was observed between TIC and malonylgenistin (r = 0.91), malonyldaidzin (r = 0.78), and genistin (r = 0.77) contents. On the other hand, the TIC was poorly correlated to glycitin (r = 0.04), acetyldaidzin (r = 0.17), and malonylglycitin (r = 0.18) contents (Table 3). The days to maturity was strongly correlated to malonylgenistin (r = 0.47) and malonylglycoside (r = 0.40) contents and TIC (r = 0.38). Meanwhile, weak and negative correlations were observed between days to maturity and daidzein (r = -0.10), acetyldaidzin (r = -0.05), and daidzin (r = -0.05) contents. Parts of the observed associations were analogous with previous findings. Strong correlations between total isoflavone and malonylgenistin, and malonyldaidzin contents were reported in soybean accessions grown in Korea (Kim et al., 2014). In another study, Kim et al. (2005) reported a strong correlation between total isoflavone and malonylglycoside contents. On the other hand, Segui et al. (2004) failed to show clear associations between individual isoflavone contents and maturity period in soybean accessions grown in Canada.
Table 3.
Correlations among days to maturity, and individual and total isoflavone contents in seeds of 49 soybean accessions grown in Korea
zDM: Days to maturity; yDZG: Daidzin; xGLG: Glycitin; wGEG: Genistin; vADZG: Acetyldaidzin; uAGLG: Acetylglycitin; tMDZG: Malonyldaidzin; sMGLG: Malonylglycitin; rDZ: Daidzein; qAGEG: Acetylgenistin; pGL: Glycitein; oMGEG: Malonylgenistin; nGE: Genistein; mTIC: Total isoflavone content. l*Significant at p < 0.05 level.
To conclude, the results of the present study revealed variation in both isoflavone composition and content in seeds of 49 soybean accessions that differ in seed coat color and days to maturity. Daidzin, glycitin, genistin, malonyldaidzin, malonylgenistin, and genistein were the most abundant isoflavones while acetylglycitin, and glycitein were the less distributed isoflavones. Accession S15(IT178054) displayed the highest TIC followed by S40(IT274571), and S27(IT231360). Moreover, accessions S41(IT274592), and S42(IT275005) were typically notable for containing the most diverse isoflavones, and hence, could be important cultivars in future agricultural systems. Among the colored groups, green with black spot soybeans displayed the maximum average TIC while pale yellow accessions showed the lowest average TIC. Furthermore, accessions that took longer days to mature contained relatively higher TIC as noted in other previous studies. To the best of our knowledge, this is the first study to observe the maximum average TIC in seeds of green with black spot soybeans. Hence, these soybeans could be sources of high isoflavone concentration. In Korea, late-maturing soybeans are highly anticipated since their cultivation avoids concurrence with other crops. Hence, late-maturing accessions such as S15(IT178054) and S40(IT274571) that displayed high total isoflavone content and offered diverse isoflavones could be important cultivars if considered in future agricultural systems.
