

Introduction
Materials and Methods
Plant materials and cultivation condition
Fertilizer treatment
Investigation of growth characteristics
Determination of chlorophyll content and fluorescence response
Statistical analysis
Results and Discussion
Effect of fertilization on growth characteristics
Effect of fertilization on biomass and distribution ratio
Effect of fertilization on chlorophyll content and fluorescence response
Introduction
Chionanthus retusus is a deciduous broad-leaved tree that belongs to the family Oleaceae. It grows naturally 50-1,100 m above sea level on the fields and mountains of central-southern Korea, and is a rare species also found distributed across China and Japan (Kim, 1997). It grows particularly favorably near valleys or brooks, along the coast or the fertile soil of sunny and deep sandy loams. Its shade tolerance is average, and it has a strong cold tolerance as well as resistance to various pollution types, salt damage and plants; however, it is weak at dehydration (Kim, 2010). Its flowers are white and bloom in May and June, while its fruits are oval-shaped drupes between 1.0-1.5 cm in size that ripen into a dark bluish-black color in September to October and hang there until winter (Michalel, 1990). Seeds of C. retusus are mostly used as tonics or anti-diarrheal drugs, as well as fever reducers or medicines for strokes. Young leaves are seasoned and eaten as greens, or used as a substitute for tea leaves (Sung, 2014). C. retusus has recently been used on streets, landscaping and ornamental trees, and it is increasingly being used as materials for dyestuff and furniture.
Korea has primarily sought to adopt a system of creating beds in open areas and sowing seeds or planting seedlings to produce a number of seedlings for landscaping and gardening trees, including C. retusus. However, this system has recently changed to producing containerized seedlings using facilities such as greenhouses. Facility cultivation of seedlings to produce containerized seedlings is a method by which the environment is artificially controlled for the healthy growth of seedlings after the seeds have been sown within a container kept in a greenhouse. The seedlings that meet the specifications can be produced within a short period of time. This method has many benefits, such as a high survival percent in planting, excellent growth potential, year-round cultivation, and the saving of labor (Wilson et al., 2007). Moreover, cultivation of bare root seedling necessitated having to undertake root pruning in the middle of growth or transplantation to accelerate the development of lateral roots and rootlets. By contrast, facility cultivation grows the seedlings within the container above the support, while any roots escaping the container drains are pruned, allowing the roots to develop favorably (Gilman et al., 2009; Landis et al., 1995; Yoon and Hong, 2002). The environmental control of growth such as light, temperature and moisture, as well as container type, bed soil and fertilization technique exert a significant influence on the process of facility cultivation (Grossnickle, 2005; Lee et al., 2006). Fertilization, by which nutrition is supplied to the plant body, is an absolutely necessary process, particularly given the character of containerized seedlings grown in bed soils (Broschat, 1995). The difference in nutrition formation and content within the soil has a variety of effects on the growth of seedlings and the changes in biomass and photosynthetic rate in proportion to the demand for nutrition by each species (Lee et al., 2006). This is reflected in various aspects of physiology and growth, bringing a change to the content of pigments such as leaf chlorophyll, as well as cells and tissues (Amott and Macey, 1984). In other words, a lack of nutrients within the soil in plant growth reduces the area of the plant leaf and the rubisco content per leaf area (Ferrar and Osmond, 1986), as well as photosynthesis and biomass (Ciompi et al., 1996; Delden, 2001; Khamis et al., 1990). Moreover, fertilization beyond the required nutrient level for the plant may create toxicity and reduce plant growth in the soil rhizosphere (Salifu and Jacobs, 2006).
There is a wealth of research on the fertilization and growth performance of containerized seedlings. Poole and Seeley (1978) reported the vegetative growth reactions that occur in soil lacking nitrogen and phosphoric acid, while Miller et al. (2006) proved that the nutrient content of tree leaves, bark, twigs and roots tends to increase after fertilization. Kim et al. (2009), and Lee and Park (2001) studied the fertilization reactions of pine seedlings. In regards to the growth performance of containerized seedlings, there have been studies such as those on the growth and physiological reactions of the Quercus species (Kim et al., 2008; Kwon and Lee, 1994; Kwon et al., 2009) and those on nutrient control suitable for the species and specifications of containerized seedlings (Alexander and Schroeder, 1987; Hathaway and Whitcomb, 1984; Timmer and Armstrong, 1987). However, on C. retusus, there have only been studies on morphology and distribution (Song et al., 2011), ecological research of colonies (Kim, 2006), and leaf antioxidants and anti-browning substance (Lee et al., 2004), with insufficient research on producing seedlings using methods such as fertilization. This study, therefore, analyzes the growth and physiological characteristics of containerized seedlings to determine the correlation between fertilization and vitality. This research contributes to the efficient and stable mass production of C. retusus, which is used in various fields such as street, gardening and landscaping trees, as well as for foods and medicines.
Materials and Methods
Plant materials and cultivation condition
The species tested in this experiment is C. retusus, and the seeds were collected from self-right standing trees growing in the Gyeonggi Mulhyanggi Arboretum located in Osan, Gyeonggi-do in mid-October 2016. The seeds were then stored in the ground. Table 1 shows the quality of the seeds. The collected seeds were sowed one per cavity in a 24-cavity plastic tray (KK-SI, Shinill Science, Korea) containing bed soil that combined peat moss, vermiculite and perlite in early April 2017. This was then kept in a greenhouse covered with 45% shade net. The germinated seedlings were used in the experiment after transplanting in a plastic pot (Ø110×H120 ㎜) in mid-March 2018.
Table 1.
Quality of C. retusus seeds used for this experiment
| Purity (%) | 1,000 seeds weight (g) | Seeds weight (g) /L | Germination (%)z | Efficiency (%) |
| 96.0 ± 2.4 | 216.3 ± 4.2 | 445.2 ± 5.8 | 64.3 ± 4.2 | 61.7 ± 5.2 |
Fertilizer treatment
Fertilizer treatment was carried out from June 1 to September 15, 2018, when the transplanted seedlings were fully adapted. We adjusted MF (N:P:K=19:19:19, Haifa Chemical CO., Israel), which is mostly used in Korea for cultivation in forestry facilities, in concentrations of 0, 1,000, 2,000, 3,000, and 4,000 ㎎/L and fertilized them once a week. One liter of fertilizer was injected into each of the 20 units of 1-year-old seedlings; water was not injected on days when there was fertilization. Similarly, we irrigated 1 L of water per unit like fertilizer every day at 10 a.m. to prevent the bed soil from drying during the growth period. We sprayed water once more at 3 p.m. during summer when the temperature was high.
Investigation of growth characteristics
To examine the growth characteristics according to fertilizer treatment, we measured the plant height (㎝) and root collar diameter (RCD) (㎜) on May 31, 2018, before fertilization and on September 30 after treatment. The average height of seedlings before fertilization was 5.2 ± 0.7㎝, and the average RCD was 1.51 ± 0.30 ㎜. Steel tape (KMC-34, Komelon, Korea) and digital caliper (D-AX/C, Mitutotyo, Japan) were used to measure the height and RCD, respectively. We then used the measurements to calculate the relative growth rate in the growth period (Beadle, 1993). We also calculated the H/D ratio [SQ: sturdiness quotient = height (㎝)/root collar diameter (㎜)] that can determine the soundness of seedlings (Bayala et al., 2009). On September 30, 2018, 20 units of seedlings before and after treatment were collected after all measurements had been completed. We measured the fresh weight (g) by dividing them into leaves, stems (including branches) and roots, and then measured the dry weight (g) after drying them for 48 hours at 70℃. We used the measurements of dry weight to calculate the biomass of each seedling, total biomass, T/R ratio and distribution ratio, i.e. leaf dry weight ratio (LWR), stem dry weight ratio (SWR), and root dry weight ratio (RWR) (Šestak et al., 1971), and calculated the seedling quality index (SQI) according to the method used by Deans et al. (1989).
Determination of chlorophyll content and fluorescence response
For the chlorophyll content in the leaves of seedlings that were fertilized, we used a SPAD meter (SPAD-502, Minolta, Japan) on July 30, 2018 and measured five leaves at the top 3 to 7 of the main body from each of the ten seedlings under treatment as the SPAD value. After examining the chlorophyll content, we then examined the chlorophyll fluorescence response of the leaves using a continuous source chlorophyll fluorometer (OSI 30P, ADC, UK). To measure the fluorescence response, we first blocked the light with sample clips using the same leaves used to measure the chlorophyll content, and took measurements after dark-adapting the leaves for 30 minutes. The light of 2,000 µmol․m-2․s-1 was examined for measurement (Choi and Kim, 1995; Demmig and Björkman, 1987; Smillie and Hetherington, 1983), and we measured and comparatively analyzed the variables of initial fluorescence response (Fo), maximum fluorescence response (Fm), the maximum change in fluorescence response (Fv = Fm - Fo) and photochemical reaction efficiency (Fv / Fm).
Statistical analysis
Statistical computations were carried out using SAS (SAS Institute Inc., USA) software. The experimental results were subjected to analysis of variance (ANOVA). The survey on differences between treatments was conducted using 20 seedlings for growth characteristics and 10 seedlings for chlorophyll content and fluorescence response. When significant differences were observed, the means were separated using Duncan’s multiple range test at the 5% or 1% significance level.
Results and Discussion
Effect of fertilization on growth characteristics
In this study, the height and RCD of seedlings were investigated to determine whether fertilization affects seedling growth and how much impact it has. Table 2 shows the results of height and RCD growth according to the fertilizer treatment of 1-year-old containerized seedlings in C. retusus. Both height and RCD growth were found to be significantly different by fertilization (p < 0.01 and p < 0.05, respectively). The plant height was higher than 8.3 ㎝ in non-treatment (0 ㎎/L) by 1.6-2.3 times, and it was highest at 19.2 ㎝ in the 2,000 ㎎/L treatment. RCD growth also increased by 1.2-1.5 times compared to 1.93 ㎜ in non-treatment. It was highest at 2.87 mm in the 2,000 ㎎/L treatment, followed by 2.59 ㎜ in 3,000 ㎎/L. However, there was no statistical difference between the two fertilization concentrations. The relative growth rate, which is the growth rate for a certain period of time, also showed a significant difference for the fertilization (p < 0.01); the relative growth rate of both the height and RCD was the highest in the 2,000 ㎎/L treatment. This was similar to the results of previous studies, with the fertilization displaying greater height and RCD growth than that of non-treatment in Quercus acutissima (Kwon et al., 2009), Q. myrsinaefolia (Sung et al., 2011), Carpinus coreana (Kim, 2013), and Q. acuta (Lee, 2014). The patterns of change in the relative growth rate vary according to climate, and plants may display various changes in growth and matter production through environmental control, particularly of moisture, light, nutrients and temperature (Lambers and Poorter, 1992). In particular, the quantity and method of fertilization have a significant effect on plant growth patterns and the excess or deficiency of nutrients compared to the amount required by containerized seedlings, which can lead to a deterioration of growth and seedling quality (Hernandez et al., 2009; Juntunen et al., 2003). This study also showed the effects of fertilization on growth patterns and relative growth rate. The H/D ratio was higher in fertilization at 5.82-7.17 than that of non-treatment at 4.39 (p < 0.01), which increased along with fertilization concentration, but showed no statistical difference from 2,000 ㎎/L and above. H/D ratio, which is the rate of growth in the above-ground part compared to that of the underground part, has been shown to determine the soundness of the cultivated seedlings (Deans et al., 1989). As an indicator for drought resistance, it is known that a higher H/D ratio indicates greater vulnerability to external environmental stress (Burdett, 1990; Grossnickle, 2012; Thompson, 1985). In the production process of containerized seedlings, the container with the greatest seedling quality per species typically displays the lowest H/D ratio (Cho et al., 2012). According to the H/D ratios of bare root seedling and containerized seedlings summarized by Johnson et al. (1996), the desirable H/D ratio of bare root seedling for pine is 6.0 or below and that of containerized seedlings is 8.0 or below. As for other needle-leaved trees, the desirable H/D ratio of bare root seedling is 7.0 or below, while that of containerized seedlings is 9.0 or 10.0 or below depending on size. For broad-leaved tree bare root seedling, 7.0 or below is the desirable H/D ratio of sound seedlings. In this study, the H/D ratio was higher in the seedlings that were fertilized. However, given the H/D ratio of sound broad-leaved tree bare root seedling while that of most containerized seedlings are approximately 2.0 higher than that of bare root seedling, this belongs to the category of sound seedlings.
Table 2.
Height and root collar diameter of C. retusus seedlings grown at different fertilization concentrations on September 30
Effect of fertilization on biomass and distribution ratio
The fresh weight of each part (leaf, stem and root) of C. retusus seedlings as well as total fresh weight according to fertilization turned out to be higher in fertilization than that of non-treatment (Table 3). There was no significant difference between the different concentrations of treatments, except for non-treatment in the case of leaves and total fresh weight. The fresh weight of stems and roots was found to be 2.89 g and 9.66 g in 2,000 ㎎/L treatment, which is 4.1 times and 1.9 times higher, respectively compared to non-treatment. The fresh weight of the above ground parts such as leaves and stems after treatment increased by 3.3-4.4 times and 2.9-4.1 times, respectively compared to non-treatment, while that of the underground part such as roots increased by 1.4-1.9 times. This result is consistent with the study by Li et al. (1991), who reported that the distribution of the biomass of above ground parts increases with fertilization. Dry weight displayed a similar tendency to fresh weight. The dry weight of leaves, stems and roots as well as total dry weight was higher in treatment than non-treatment by 2.4-3.0 times, 2.8-4.2 times, 1.5-1.9 times, and 1.9-2.4 times, respectively (p < 0.01). There was generally no difference found among concentrations, except for the case of non-treatment. Moreover, the part with the highest dry mass production was the stem, which was highest in 2,000 ㎎/L. In general, high concentrations of fertilization, particularly high concentrations of nitrogen, which is quickly absorbed by plants among mineral nutrients, accelerates stem growth, leading to an increase in dry mass production (Cornett, 1982). The T/R ratio was 0.44 in non-treatment, and 0.64, 0.82, 0.94, and 0.86 respectively according to concentrations (Fig. 1).
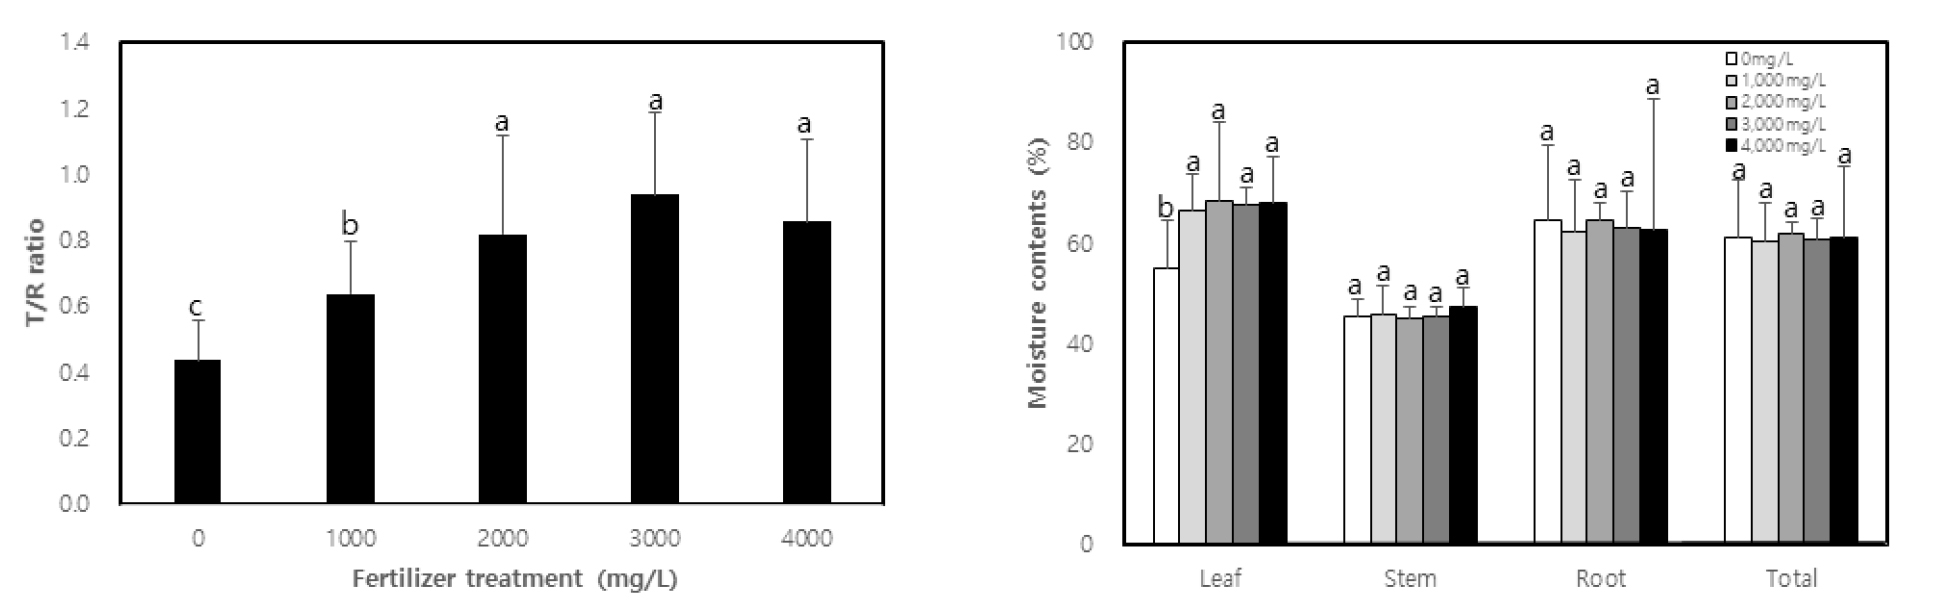
Table 3.
Fresh and dry weight of C. retusus seedlings grown at different fertilization concentrations
It was higher in treatment than non-treatment (p < 0.01), with no statistical difference from 2,000 ㎎/L and above. Seedlings with a low T/R ratio are considered to have good quality in general and, in this study, treatment displayed a higher T/R ratio than non-treatment. This may be due to the growth of the above ground parts, which became more active than the underground parts through active photosynthesis activity with sufficient nutrition. Li et al. (1991), Malik and Timmer (1998) and Proe and Millard (1994) have reported that if seedlings undergo active growth after fertilization, then the growth of above-ground parts accelerates, increasing the T/R ratio. Chung et al. (2012), Kim (2013) and Kwon et al. (2009) have separately demonstrated that the T/R ratio increases after fertilizer treatment. According to Haase (2007), sound seedlings must have a T/R ratio of 3.0 or lower if they are bare root seedling, and a T/R ratio of 2.0 or lower if they are containerized seedlings. Seedlings in Korea are also considered sound if the T/R ratio is within the range of 2.5-3.0. When comparing this T/R ratio with the results of the experiment, the latter showed lower values. The values were lower than 1.0 in all treatment concentrations, which may be due to the explanation provided by Kim (2011), who reported that C. retusus displays slow growth in the first and second year, but grows rapidly from the third year. Also, for that reason, the T/R ratio is one of the indicators that has long been used to assess the quality of seedlings. It was designed as a means to measure the balance between the above ground parts in charge of increased production of seedlings and underground roots in charge of water absorption (Haase, 2007). As mentioned by Thompson (1985), it is controversial to use the T/R ratio to determine the quality of seedlings. As for the moisture content of each part, there was no significance difference found between treatment and non-treatment in all parts, except leaves (Fig. 1). The moisture content of the leaves was higher in the treatments than in the non-treatment. That may be due to the fact that leaves have a higher ratio of moisture use than the rate of growth speed increase while stems and roots use moisture in the same ratio as the growth speed in fertilization.
To determine whether there is balanced growth of containerized seedlings in C. retusus in each concentration, we evaluated the leaf dry weight ratio (LWR), stem dry weight ratio (SWR), root dry weight ratio (RWR) and seedling quality index (SQI) (Table 4). Control of LWR, SWR, and RWR, the distribution ratios of matters produced by photosynthesis in plants, is the plants’ adaptive response to given environmental conditions, such as light, moisture and nutrients (Gleeson, 1993; Hilbert, 1990; Reynolds and Antonio, 1996). LWR was higher in treatment than that of non-treatment, showing the highest values in the 3,000 mg/L and 4,000 ㎎/L treatments. SWR was also higher in all treatment concentrations, with no significant difference found in concentrations of 2,000 ㎎/L and above. The same broad-leaved species like oak (Kwon et al., 2009) and Korean hornbeam (Kim, 2013) showed no difference in LWR between treatment and non-treatment, while needle-leaved species like nut pine (Kim, 2013) tended to show an increase in LWR and SWR after fertilization, which is similar to the results of this study. By contrast, RWR was lower after fertilization compared to non-treatment, which supports the results of the study by Kim (2013). Sung et al. (2011) stated that this change may be a reaction to the relatively richer growth environment compared to fertilization. Schlichting (1986) argued that many organisms adjust their own growth reactions according to environmental conditions, while plants also react to such conditions with physiological or morphological flexibility. The SQI, which is an integrated indicator used to assess the quality of seedlings (Bayala et al., 2009; Mattsson, 1996; Thompson, 1985), was generally within the range of 0.52-0.82. It was higher in fertilization, and highest in 1,000 ㎎/L and 2,000 ㎎/L treatments, at 0.80 and 0.82, respectively. In general, a higher SQI indicates sound seedlings, provided that the seedlings have grown up normally. Many research findings have shown that an increase in the SQI of seedlings can be achieved through fertilization. Lee (2014) stated that, among evergreen oaks, myrsinaleaf oak and Japanese evergreen oak display the highest SQI, at 0.49 and 0.44, respectively, in multifeed 2,000 ㎎/L treatment. Kim (2013) reported that the SQI of Korean hornbeam seedlings was the highest in multifeed 2,000 ㎎/L. Cho et al. (2011b) analyzed the SQI of three fertilization methods (constant, three stage and exponential) for tulip trees. Cho et al. (2012) and Kim (2014) studied the SQI according to the fertilization of containerized seedlings in nut pine and pine, and proved that it increased by at least 2.5 times.
Table 4.
Leaf weight ratio (LWR), stem weight ratio (SWR), root weight ratio (RWR) and seedling quality index (SQI) of C. retusus seedlings grown at different fertilization concentrations
As a result of examining general growth characteristics, it was found that height, RCD, fresh weight, dry weight and matter distribution ratio were high after fertilization, and this effect was found to be greatest in the 2,000 ㎎/L treatment. However, seedlings with excellent height, RCD and biomass do not always have good quality. The quality of seedlings is considered suitable when the growth is well balanced between the above ground parts and underground parts, as well as in consideration of their physiological characteristics (Cho et al., 2012). It was therefore necessary to develop a value index model in connection with the results of physiological characteristics such as photosynthesis and chlorophyll fluorescence response along with the results of growth and morphological characteristics (Davis and Jacobs, 2005; Gazal et al., 2004).
Effect of fertilization on chlorophyll content and fluorescence response
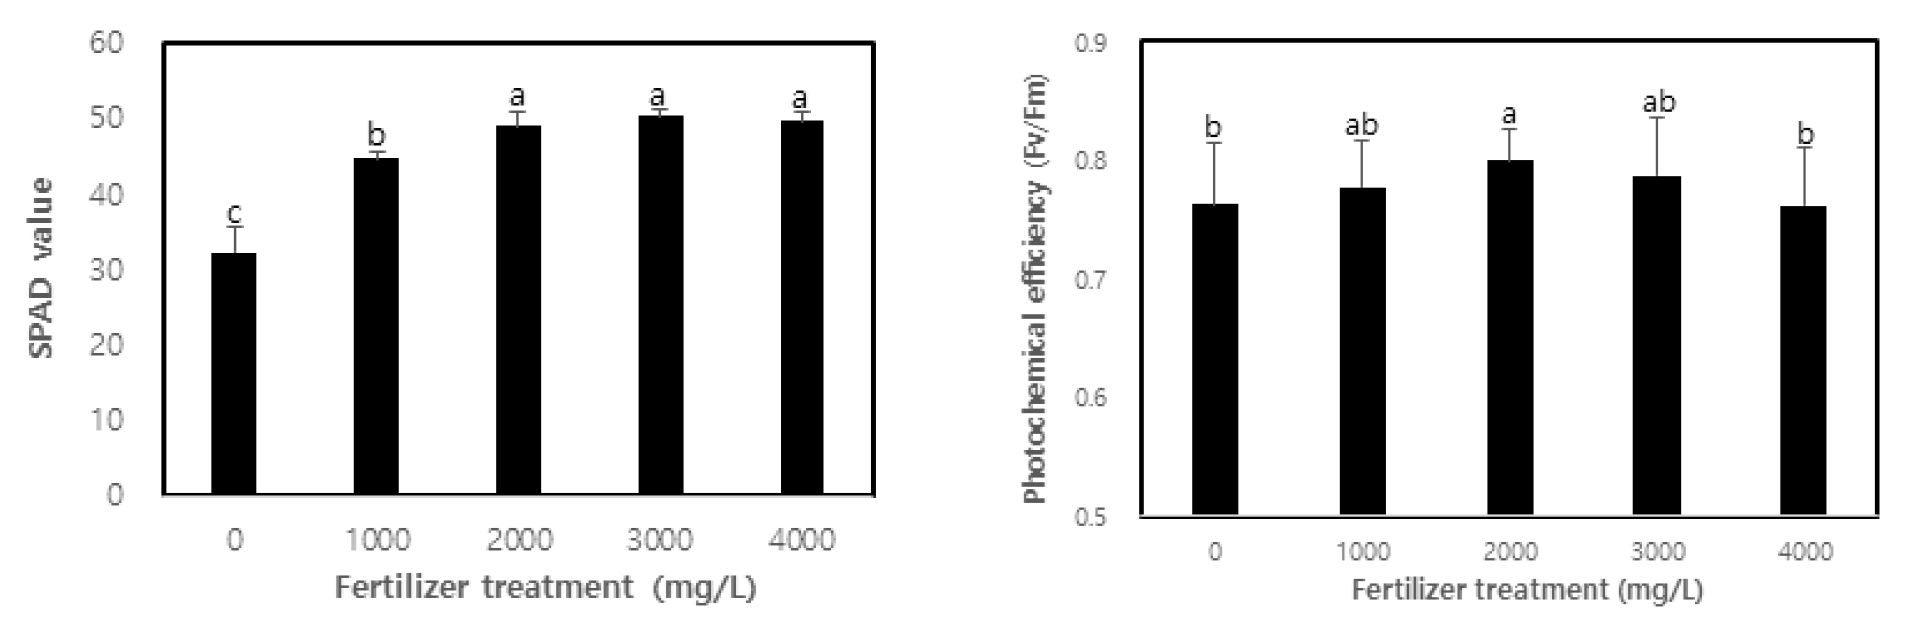
This study evaluated the vitality of containerized seedlings in C. retusus based on the chlorophyll content and chlorophyll fluorescence response after fertilization. As shown in Fig. 2, the vitality of seedlings varied according to fertilization. The chlorophyll content (SPAD value) was found to be higher in treatment with SPAD values of 32.2, 44.7, 49.1, 50.3, and 49.8 from non-treatment to 4,000 ㎎/L treatment (p < 0.01), with no significant difference found among concentrations of 2,000 ㎎/L and above. One of the key elements to determining the efficiency of plant growth according to fertilization is the chlorophyll content of plants that react sensitively to nitrogen content (Kopsell et al., 2004; Tatjana et al., 2007). The correlation between a plant’s chlorophyll content and useful nitrogen content has been demonstrated by many studies (Khamis et al., 1990; Terashima and Evans, 1988; Verhoeven et al., 1997). In general, a higher utility of nutrients in the growth phase of a plant increases the concentration of nutrients in the plant body (Malik and Timmer, 1998; Sung et al., 1997). In this study, the nitrogen content of the leaves of C. retusus may have increased with the fertilization level of MF containing nitrogen, thereby resulting in the increase of chlorophyll content. Hwang et al. (2003) and Kwon et al. (2009) have shown that chlorophyll content increases in oak seedlings after fertilization. This can be explained as the optimal nutrition conditions being maintained for fertilization, which promotes active growth while also increasing chlorophyll content. Moreover, an excess or deficiency of nutrients for fertilization in the production process of containerized seedlings may hinder photosynthesis ability as at least 70% of the nitrogen contained in leaves composes protein related to photosynthesis, and may have a significant influence on the creation of chlorophyll, which is closest to the photosynthesis activity (Hikosaka and Terashima, 1995). The increased chlorophyll content resulting from fertilization has been shown by Chung et al. (2012), Kim et al. (2013), Minotta and Pinzauti (1996) and Yoon (2013).
Photochemical efficiency (Fv/Fm), which is the maximum value of apparent quantum yield in photochemical reactions, is one of the variables of chlorophyll fluorescence to be used as an indicator for the overall functionality, stress and vitality of photosynthesis as well as the functionality of the photosystem as it absorbs light (Sung et al., 2010). In this study, photochemical efficiency was found to be higher in treatment than non-treatment (p < 0.05), showing the highest photochemical efficiency at 0.8 in the 2,000 ㎎/L treatment (Fig. 2). Photochemical efficiency represents the vitality of photosystem II and is used as an indicator for plant reactions to stress and vitality in terms of the ability to acquire excitation energy (Rascher et al., 2000; Sung et al., 2011). In general, if the value of photochemical efficiency is lower than 0.8, it can be said that the reaction center of photosystem II is damaged or in a state of inactivity (Bolhàr-Nordenkampf et al., 1989). In this study, the photochemical efficiency of all concentrations except 2,000 ㎎/L treatment was lower than 0.8, which falls short of the standard for sound leaves. This is due to the fact that 1-year-old containerized seedlings of C. retusus have low resistance to stress from the growth environment, such as light, temperature and moisture, regardless of fertilization. Furthermore, photochemical efficiency gradually decreased in concentrations higher than 2,000 ㎎/L treatment, which is consistent with the study by Cho et al. (2011a), which states that an adequate fertilization level leads to active photosynthesis with high chlorophyll content and photochemical efficiency. While this enables high growth and excellent seedling production, unreasonably excessive fertilization may in fact hinder growth. Cho et al. (2011b) also showed that photochemical efficiency was high with a significant difference in fertilization of Eucalyptus pellita and Acacia mangium. Choi et al. (2013) have provided results similar to this study by reporting that the photochemical efficiency of sawleaf zelkova and ash tree seedlings, which were fertilized to an optimal level, was high. However, Hwang et al. (2013) argued that there was no significant difference in photochemical efficiency due to fertilization in the case of the containerized seedlings of lime trees.
Judging from the chlorophyll content and chlorophyll fluorescence response, fertilization in the production process of containerized seedlings has a significant effect on not only the ability to secure light in the process of light reaction (Kwon et al., 2009), but also the production and quality of seedlings in connection with photosynthesis and growth activities. It is therefore necessary to apply a suitable amount of fertilizers in line with growth patterns.
