

Introduction
Materials and Methods
Chemicals and Reagents
Plant Materials
Sample Preparation
UPLC-PDA Analysis
Determination of Total Phenolic Content (TPC)
Statistical Analysis
Results and Discussion
Morphological Characters
Contents of Total and Individual Phenolic Compounds
Correlations between Phenolic Compounds and Morphological Characters
Introduction
Perilla (Perilla frutescens) belongs to the family Lamiaceae. It is an annual plant widely cultivated in Asian countries such as Korea, China, Japan, Vietnam, Thailand, Taiwan, and India (Hu et al., 2010). There are two types of varieties of perilla (crispa and frutescens) based on their morphology and utilization (Luitel et al., 2017). Traditionally, perilla provides two aspects of uses: edible and medicinal (Yu et al., 2017). Perilla is an important cash crop in Korea. Their fresh leaves are generally consumed along with meat. They are also used in salads, sushi, soup, and for making pickles (Kwon et al., 2017). Perilla plant is an important source of bioactive compounds such as phenolic compounds, triterpenes, volatile compounds, fatty acids, policosanols, tocopherols, phytosterols, hydrocarbons, alcohols, aldehydes, and furans (Yu et al., 2017). Phenolic compounds are among the most widespread class of phytochemicals in nature. They are also present in perilla. The main phenolic compounds reported in perilla include caffeic acid, rosmarinic acid, luteolin, apigenin, chrysoeriol, scutellarein, and their glucosides, glucuronide, diglucosides, diglucuronides (Assefa et al., 2018; Guan et al., 2014; Lee et al., 2013;Meng et al., 2009).
An extensive study of phenolic compounds of Perilla frutescens obtained from different parts of the world could provide comprehensive information to consumers and nutraceutical industries on phytoconstituents of perilla. Recently, Assefa et al. (2018) have characterized some major phenolic compounds such as 4-hydrobenzoic acid, caffeic acid, 4-coumaric acid, 5’-gluco-pyranosyoxyjasmanic acid, luteolin-7-O-diglucuronide, apigenin-7-O-diglucuronide, apigenin-7-O-glucuronide, scutellarein- 7-O-glucuronide, and rosmarinic acid from leaves of 73 perilla accessions collected from Korea. Rosmarinic acid was found to be the major phenolic compound, followed by scutellarein- 7-O-glucuronide in perilla leaves. Qualitative and quantitative morphological characters have been used to distinguish different varieties of plant materials (Luitel et al., 2017; Hasanuzzaman et al., 2016). For instance, a recent study has reported that cultivated and weedy type perilla germplasm collections show a wide variety of morphological characters (Luitel et al., 2017). Phenolic compounds have been reported to be useful for distinguishing cultivars and varieties of some plant materials (Klepacka et al., 2011). The objective of the present study was to evaluate profiles of total phenolic content and major phenolic compounds in 782 germplasm collections of perilla leaves collected from more than seven countries (China, Japan, Korea, Myanmar, Poland, Romania, Russia, and unknown origin). In addition, we evaluated whether prominent phenolic compounds could be used as distinguishing factors of perilla germplasm collections.
Materials and Methods
Chemicals and Reagents
Folin-Ciocalteu reagent, formic acid, rosmarinic acid, luteolin, caffeic acid, and gallic acid were obtained from Sigma-Aldrich (St. Louis, MO, USA). All standards and reagents were of HPLC grade with purity ≥ 98%. All solvents used in extraction and analyses were of HPLC grade. They were purchased from Fisher Scientific Korea Ltd. (Seoul, Korea).
Plant Materials
A total of 782 accessions of perilla germplasm collections (81 breeding line, 50 cultivar, 412 landrace, 139 weedy type, and 97 unknown type/s belonging to P. frutescens var. frutescens; one accession from each of landrace, weedy type, and wild type belonging to Perilla sp, and one weedy type belonging to Perilla frutescens var. crispa) were obtained from the National Agrobiodiversity Center (NAC), Rural Development Administration (RDA), Jeonju, South Korea. Seeds were sown in the research farm of the NAC (35°49′18″N, 127°08′56″E) and 10 plants of each accession were secured. The planting density was 60 × 30 ㎝. RDA’s recommended cultural management practices for perilla were followed in the field.
Sample Preparation
Samples were prepared following previously reported method (Assefa et al., 2018). Briefly, leaves of perilla were subjected to drying using a VS-1202D drying oven (Vision Scientific, Bucheon, South Korea) for three days at 40℃. Two grams of oven-dried perilla leaves were mixed with 40 mL of 75% (v/v) ethanol. Extraction was then performed using an accelerated solvent extractor (ASE) (Model ASE-200, Dionex, Sunnyvale, CA, USA) under nitrogen gas at a pressure of 1200 psi and a temperature of 70℃. Dried flakes of perilla leaf sample were placed in a 34 mL Dionex™ ASE™ stainless steel extraction cells. Extraction was conducted for 15 min in three cycles, with purging time set at 90 s. Circular cellulose filters (diameter 19.88 mm, Dionex Corporation) were used to prevent solid particles entering to sample collection material. A 60 mL glass tube was fitted with a Teflon-coated rubber cap and arranged at designated carousels. Each extract was transferred to a 50 mL plastic conical tube and the solvent was removed in the subsequent process. Extracted samples were dried using a Genevac HT-4X (Ipswich, Suffolk IP1 5AP, UK) evaporator at 40℃ for 10 h. Extraction yield was in the range 8.79 to 11.02% for all samples. Test solutions were prepared by re-dissolving the dried extract at appropriate concentrations. Test solutions were filtered through 0.45-µm syringe filters prior to analysis.
UPLC-PDA Analysis
Identification and quantification of individual phenolic compounds in perilla germplasm were carried out using an Agilent 1290 infinity Ultra-High Performance Liquid Chromatography (UPLC) system equipped with PDA detector. An Eclipse plus C18 (1.8 µm, 2.1 mm x 50 mm) column was used for separation of phenolic compounds. The column thermostat was maintained at 25℃. The mobile phase was composed of 0.1% formic acid in water (A) and 0.1% formic acid in ACN (B) with elution program as follows: 0-5 min, 92-85% A; 5-10 min, 85-82% B; 10-15 min, 82% A followed by 10 min post-run analysis. The flow rate was held at 0.4 mL/min and the injection volume was 2 µL. The detection wavelength was at 330 nm. Quantification was done using calibration equations derived from calibration curves of corresponding standards. Contents of ADG, SG, and AG were estimated using calibration equations derived from calibration curves of luteolin standard. The equations used for calculations were Y = 244102X - 8.0282 (caffeic acid, R2=0.9999); Y = 200961X - 19.3 (rosmarinic acid, R2=0.9999); and Y = 43755X - 8.4813 (luteolin, R2= 0.9999). Y stands for area and X for concentration.
Determination of Total Phenolic Content (TPC)
Total phenolic content was determined by using the Folin- Ciocalteu method as described by Waterhouse (2002) with some modifications. Briefly, 100 µL of water was added to 100 µL of sample solution followed by addition of 100 µL Folin-Ciocalteu reagent. The mixture was allowed to react at room temperature for 3 min. To this mixture, 100 µL of 2% sodium carbonate solution was added and incubated at room temperature for 2 h. Absorbance was measured at 765 nm using an Eon Microplate Spectrophotometer (BioTek, Winooski, VT, USA) with 75% ethanol as blank. Results were expressed as mg gallic acid equivalent per gram (mg GAE/g) dry weight of extract (DE) based on the calibration equation (Y = 6.9632X - 0.0288, where Y=absorbance, X=concentration; R2=0.999) derived from the calibration curve of gallic acid.
Statistical Analysis
Quantitative data were analyzed using PAST (Palaeontological statistics, version 3.06) (Hammer et al., 2001). Correlations between traits were studied with respect to TPC, individual phenolic compounds, quantitative morphological traits, and qualitative morphological traits.
Results and Discussion
Morphological Characters
Qualitative (abaxial and adaxial leaf color, leaf shape, and pubescence distribution) and quantitative (leaf length and width) morphological characters were evaluated in 782 germplasm collections of four types (breeding line, cultivar, landrace, and weedy type) of perilla. The leaf color of investigated accessions was not uniform for abaxial and adaxial surfaces of leaves. Most accessions pigmented light green on the abaxial (reverse) sides of leaves were green pigmented on the adaxial (front) side of leaves. There were no accessions to be described as dark green on the abaxial side of leaves, while 172 accessions were dark green on the adaxial side of leaves. Assessment of the adaxial leaf color showed that 60.5%, 22.0%, and 16.4% of collections were green, dark green, and light green, respectively. The remaining accessions were dark purple colored. The leaf color at abaxial surface was light green in 76.3% of accession and green in 18.5% of accessions. Light and dark purple colors at abaxial surface of leaves were observed in 1.1% and 4.1% of collections, respectively. Luitel et al. (2017) have described that leaf color of perilla germplasm accessions collected from Korea is green, light green, deep green, and green purple at the adaxial side and light green, green, green purple, purple, and purple green at the abaxial side. A total of sixty germplasm accessions collected from China, Korea, Japan, and Nepal exhibited green, green with weak purple, purple, and deep purple leaf color, respectively (Kyong and Ohnishi, 2001). Leaf shape described as cordate or eclipse was observed. Most (97.3%) accessions had eclipse leaf shape. The distribution of pubescence was regarded as normal in 96.3%, few in 2.2%, and many in 1.5% of accessions. Leaf length and width measured for 782 accessions are summarized in Table 1. Leaf length and width of all collections ranged from 9.15 to 23.90 ㎝ (average 15.61 ㎝) and from 7.00 to 19.75 ㎝ (average 12.08 ㎝), respectively. These values are in concordance with previous reports (Leaf length: 11.87 to 16.39 ㎝; leaf width: 9.56 to 12.77 ㎝) (Ghimire et al., 2019). Perilla frutescens var. frutescens and crispa germplasm accessions collected from Korea exhibited leaf length of 9.7 to 28.3 ㎝ and leaf width of 7.0 to 17.0 ㎝ (Luitel et al., 2017). Accessions of breeding line perilla exhibited the highest average values of leaf length and width (16.9 and 13.07 ㎝, respectively) while weedy types had the lowest leaf length and width (13.94 and 10.96 ㎝, respectively). Dark purple pigmented accessions had shorter leaf length and width than light green, green, dark green, or light purple pigmented germplasm collections based on average value.
Table 1. Ranges of total phenolic content, individual phenolic compounds, leaf length, and leaf width of perilla based on different morphological characters
Contents of Total and Individual Phenolic Compounds
Five predominant phenolic compounds (chromatograph presented in Fig. 1) were quantified in leaves of perilla genetic resources. Identification was done by comparison with the retention time and UV spectra for those with the standards available, and their mass fragmentation pattern for others as reported in our earlier work (Assefa et al., 2018). Individual and total phenolic compositions covered a wide range of values. Total phenolic content across the entire collections of perilla germplasm ranged from 7.99 to 133.70 mg GAE/g DE, with average value of 66.07 mg GAE/g DE. Kongkeaw et al. (2015) have reported total phenolic contents of perilla seeds (2954 ± 217.32 mg GAE/g DW in brown perilla seed and 1290.24 ± 112.55 mg GAE/g DW in white perilla seed). These values were higher than those in perilla leaves in our study. According to Radacsi et al. (2017), TPCs in leaves and stems of five accessions of Perilla frutescens ranged from 84.740 to 204.320 mg GAE/g dry matter (DM) and from 60.977 to 90.902 mg GAE/g DM, respectively. These values in leaves were higher than our study results (7.99 to 133.70 mg GAE/g DE) and reports for leaves of Perilla frutescens by other authors [i.e., 4 to 27 mg/g DM (Meng et al., 2009), 117 mg GAE/g DE (Jun et al., 2014), 9.81 to 92.81 mg GAE/g DE (Assefa et al., 2018), 48.85 mg GAE/g DW (Li et al., 2016), 7.0 to 11.7 mg/g fresh weight (FW), 12.15 mg GAE/g DW (Hong and Kim, 2010), and 54.3 to 123.2 mg catechin eq./g DE (Gai et al., 2017). Genetic resources containing the highest phenolic compounds are presented in Table 2. RA was detected as the predominant metabolite in most (94.5%) accessions, followed SG which predominated in 4.6% of the entire germplasm collections. RA exhibited a considerable variation, ranging from ND to 21.05 mg/g DE with an average value of 6.79 mg/g DE. Recently, four major phenolic compounds (rosmarinic acid-3-O-glucoside, rosmarinic acid, luteolin, and apigenin) in seeds of 578 perilla germplasm were investigated (Ha et al., 2018). It was found that rosmarinic acid was the predominant (62.8%) compound. Ha et al. (2018) have reported that the concentration of rosmarinic acid ranges from 0.28 to 3.23 mg/g DW (mean 1.26 mg/g DW) in seeds of 578 perilla germplasms and from 1.33 to 1.39 mg/g in seeds of 39 perilla cultivars. A comparable amount (0.21 to 3.76 mg/g DW) in perilla leaf extracts was also determined in another study (Hong and Kim, 2010). In comparison with results of the present study (ND to 21.05 mg/g, mean 6.79 mg/g DE), after recalculating values in terms of dry weight considering a 10% extraction yield, perilla leaves were found to contain comparable amounts of rosmarinic acid in seeds and leaves of perilla with previously reported values (Ha et al., 2018; Hong and Kim, 2010). On the other hand, quite higher amount of rosmarinic acid content than our study results have been reported in whole parts (26.44 to 66.17 mg/g DE) (Gai et al., 2017) and leaves (84.7 mg/g DE; ND to 8.4 mg/g DM) (Jun et al., 2014; Meng et al., 2009) of Perilla frutescens L. A recent study has shown that caffeic acid content in leaves of Perilla frutescence Britton var. Japonica accessions ranges from 0.00 to 0.288 mg/g DE (Ghimire et al., 2019), falling to the range of CA content in our study (ND to 1.17 mg/g DE). Previously reported CA contents (0.48 to 1.22 mg/g DE) in leaves of 73 perilla accessions by Assefa et al. (2018) were also in concordance with results of the present study. However, quite larger amount of CA content (1.9 mg/g DE) was recorded in 80% ethanol extract of perilla leaf (Jun et al., 2014). Reports on contents of ADG, SG, and AG are illusive. In the present study, ADG, SG, and AG contents ranged from ND to 2.21, ND to 5.25, and ND to 2.81 mg LUE/g DE, respectively. Apigenin equivalent concentrations of ADG, SG, and AG in a separate study of 73 accessions of perilla leaves were 0.17-1.18, 0.79-4.55, and 0.24-0.276 mg/g DE, respectively (Assefa et al., 2018). These values are fairly in agreement with results of the present study.
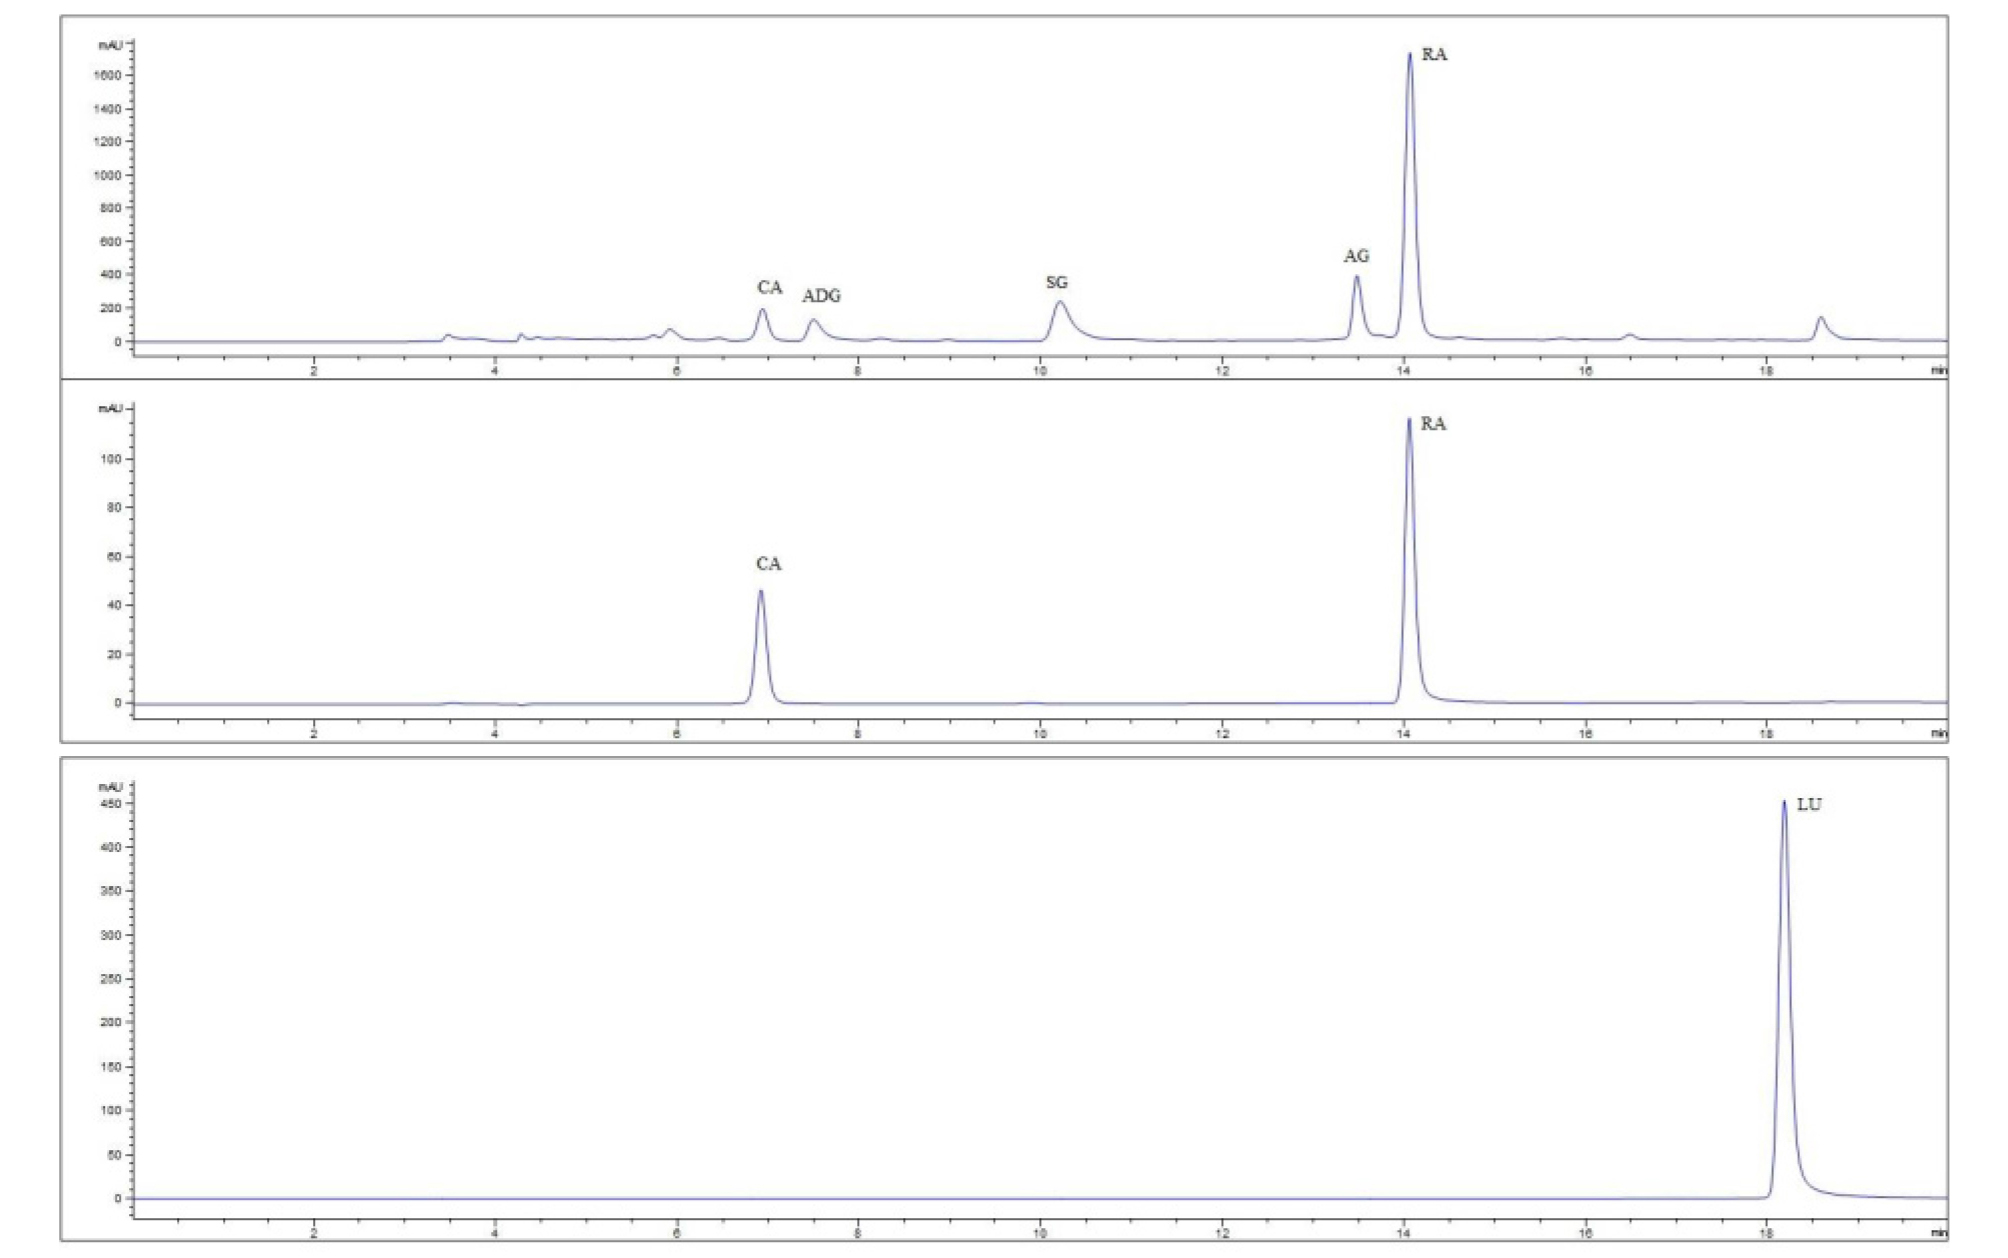
Fig. 1.
Representative UPLC-PDA chromatograph of phenolic compounds recorded at 330 nm of perilla leaf sample (top), caffeic acid (CA) and rosmarinic acid (RA) standards (middle) and lueteolin (LU) standard (bottom). ADG = Apigenin-7-O-diglucoronide (ADG), SG = scutellarein-7-O-glucoronide; and AG = apigenin-7-O-glucoronide.
Table 2. Selected perilla germplasms (top 5) containing the highest amount of TPC and individual phenolic compounds
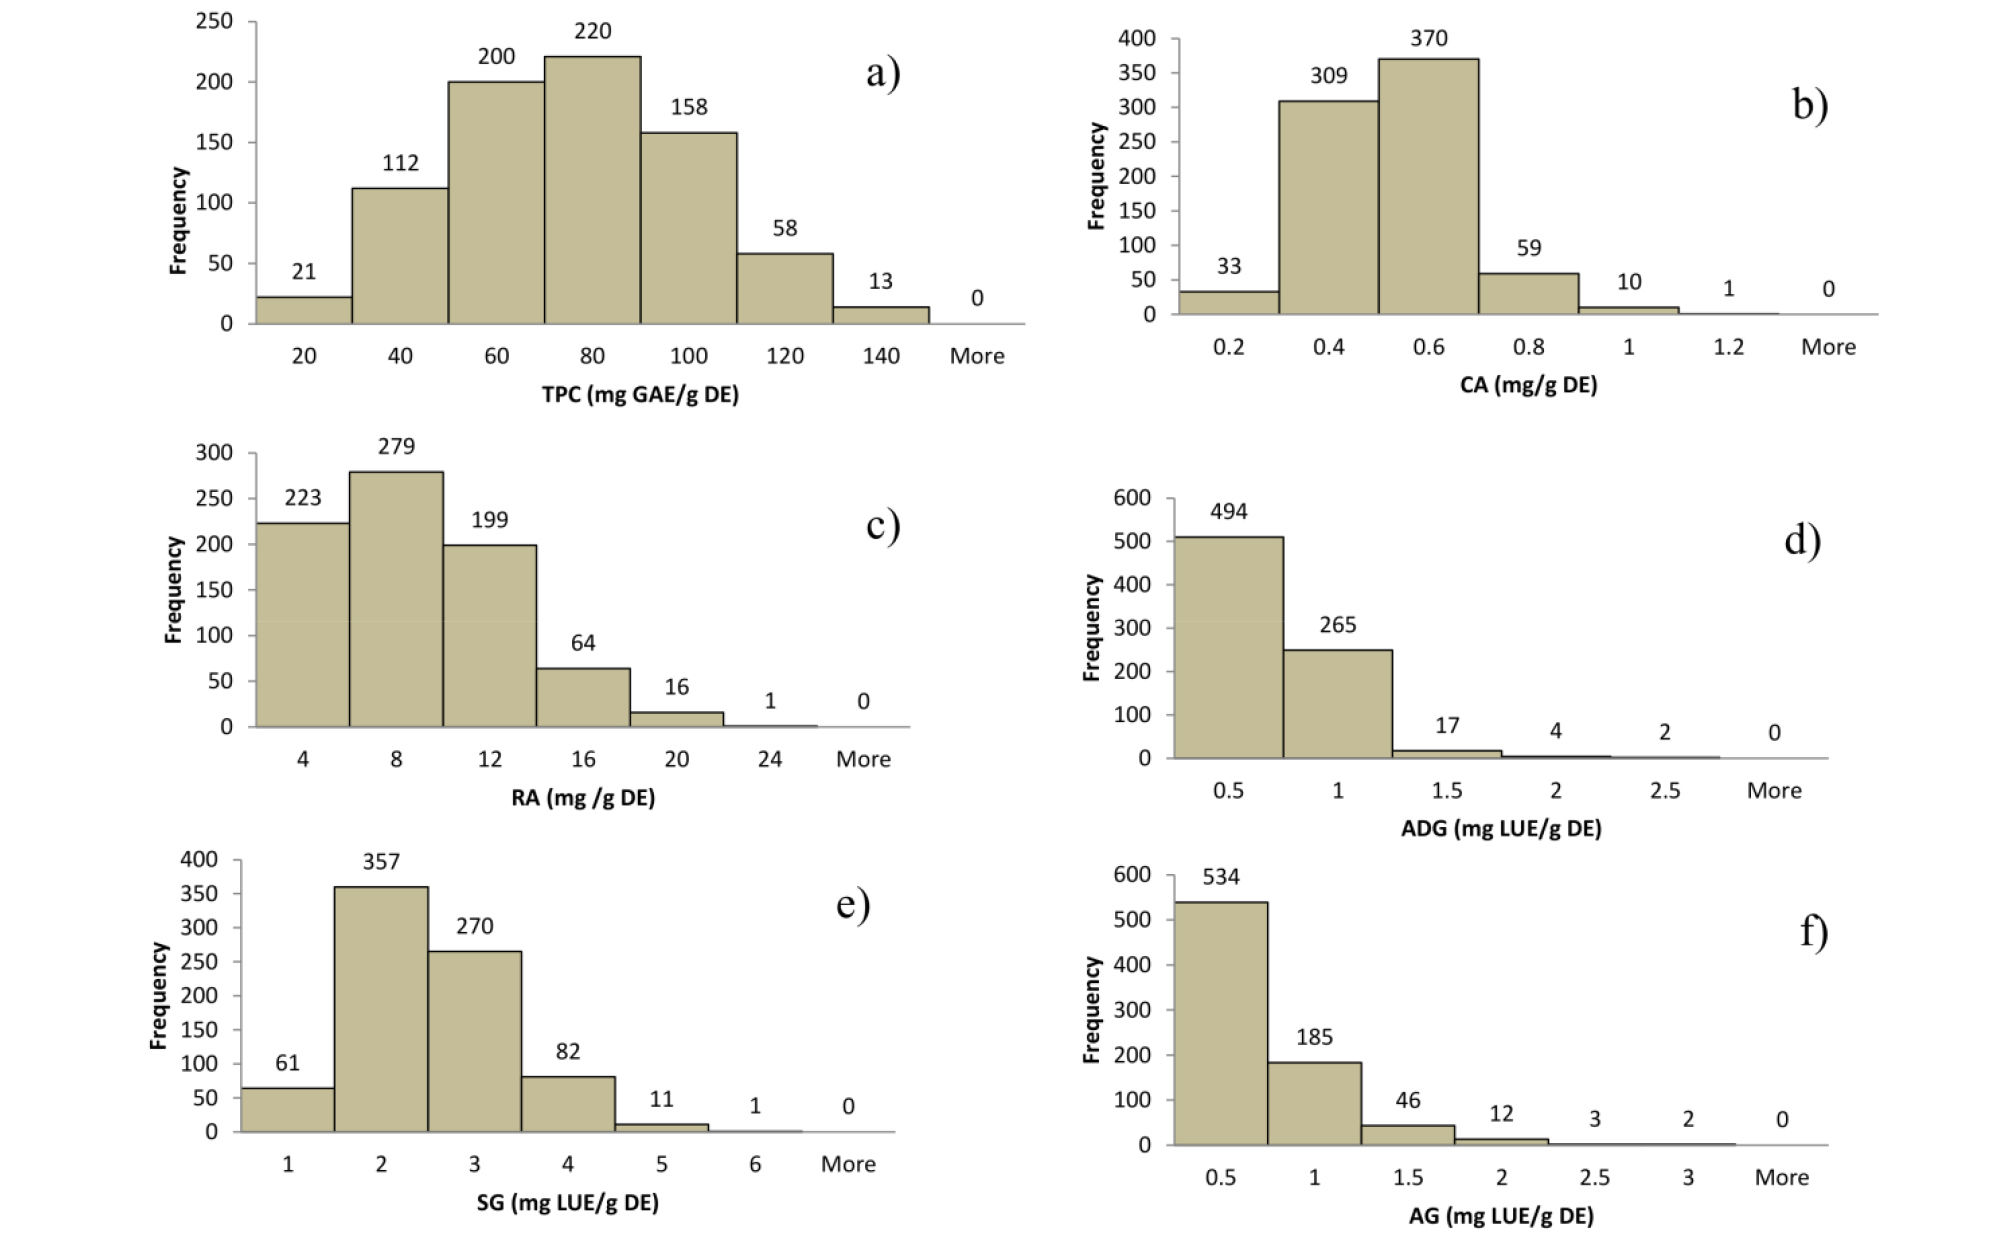
Frequency distributions of total phenolic content and individual phenolic compounds are presented in Fig. 2 (A-F). The frequency of distribution of total phenolic content in these 782 accessions showed a normal distribution (Fig. 2A). Most (74%) accessions were in the range of 40.00 to 100.00 mg GAE/g DE, while 112 accessions had a range of 20.00 to 40.00 mg GAE/g DE, 58 had a range of 100.01 to 120.00 mg GAE/g DE, and 22 and 13 showed < 20.00 mg GAE/g DE and > 120.00 mg GAE/g DE, respectively. The distribution of two individual phenolic compounds, CA and SG, also showed a near normal distribution. For CA content, most (86.8%) accessions fell in the range of 0.20 to 0.60 mg/g DE. Thirty-three accessions had less than 0.2 mg/g DE of CA content. Ten accessions had 0.80 to 1.00 mg/g DE of CA content while a single accession had greater than 1.00 mg/g DE of CA content. For SG content, 80% of accessions were in the range of 1.01 to 3.00 mg LUE/g DE. The SG content was less than 1.00 mg LUE/g DE in 61 accessions, between 3.00 and 4.00 mg LUE/g DE in 82 accessions, between 4.00 and 5.00 mg LUE/g DE in 11 accessions, and greater than 5.00 mg LUE/g DE in a single accession. The frequency of the content of the other three phenolic compounds (RA, ADG, and AG) failed to follow a normal distribution. For RA content, 28.52%, 35.68%, and 25.45% accessions had less than 4.00 mg/g DE, between 4.00 and 8.00 mg/g DE, and between 8.00 and 12.00 mg/g DE, respectively. Of all the germplasm collections, 97.01 and 91.94% had ADG and AG contents of less than 1 mg LUE/g DE, respectively.
Correlations between Phenolic Compounds and Morphological Characters
The range and average values of TPC and individual phenolic compounds based on different morphological characters are summarized in Table 1. Weedy type germplasm collections (a total of 140 accessions) had an average value of total phenolic content at 72.27 mg GAE/g DE, quite higher than average values of breeding line (81 accessions), cultivar (50 accessions), and landrace (413 accessions) types. Dark purple pigmented accessions contained the largest average total phenolic content whereas light green pigmented accessions had the smallest average total phenolic content
The significance of the effect of different morphological characters on morphological characters are evaluated, and results are summarized in Tables 3 and 4. The trend in content of average individual phenolic compounds between different morphological characters was inconsistent. However, Pearson correlation between analyzed discriminants showed that there were significant (P < 0.05) and positive correlations of intensity of green pigment of leaves with TPC, CA, RA, and ADG while inverse relationships of intensity of green pigment of leaves with SG and AG were found (Fig. 3). Purple pigmented perilla accessions contained higher TPC, CA, RA, and ADG but lower SG and AG compared to green pigmented accessions. Leaf length and width were negatively correlated with total phenolic content and contents of individual phenolic compounds, further corroborating that dark purple pigmented perilla leaves contained higher phenolic compounds. In addition, purple pigmented accessions were shorter in leaf length and leaf width. Number of leaf hair (pubescence distribution) was positively correlated with leaf length and leaf width. Purple pigmented leaves were associated with low pubescence distribution. Leaf shape was uncorrelated with contents of all individual phenolic compounds, color, length, and width of leaves.
Table 3. Effect of leaf color, pubescence distribution and plant type on phenolic compounds, leaf length and width of perilla genetic resources
Table 4. ANOVA showing the significance level of the content of phenolic compounds, leaf length and leaf width of the genetic resources
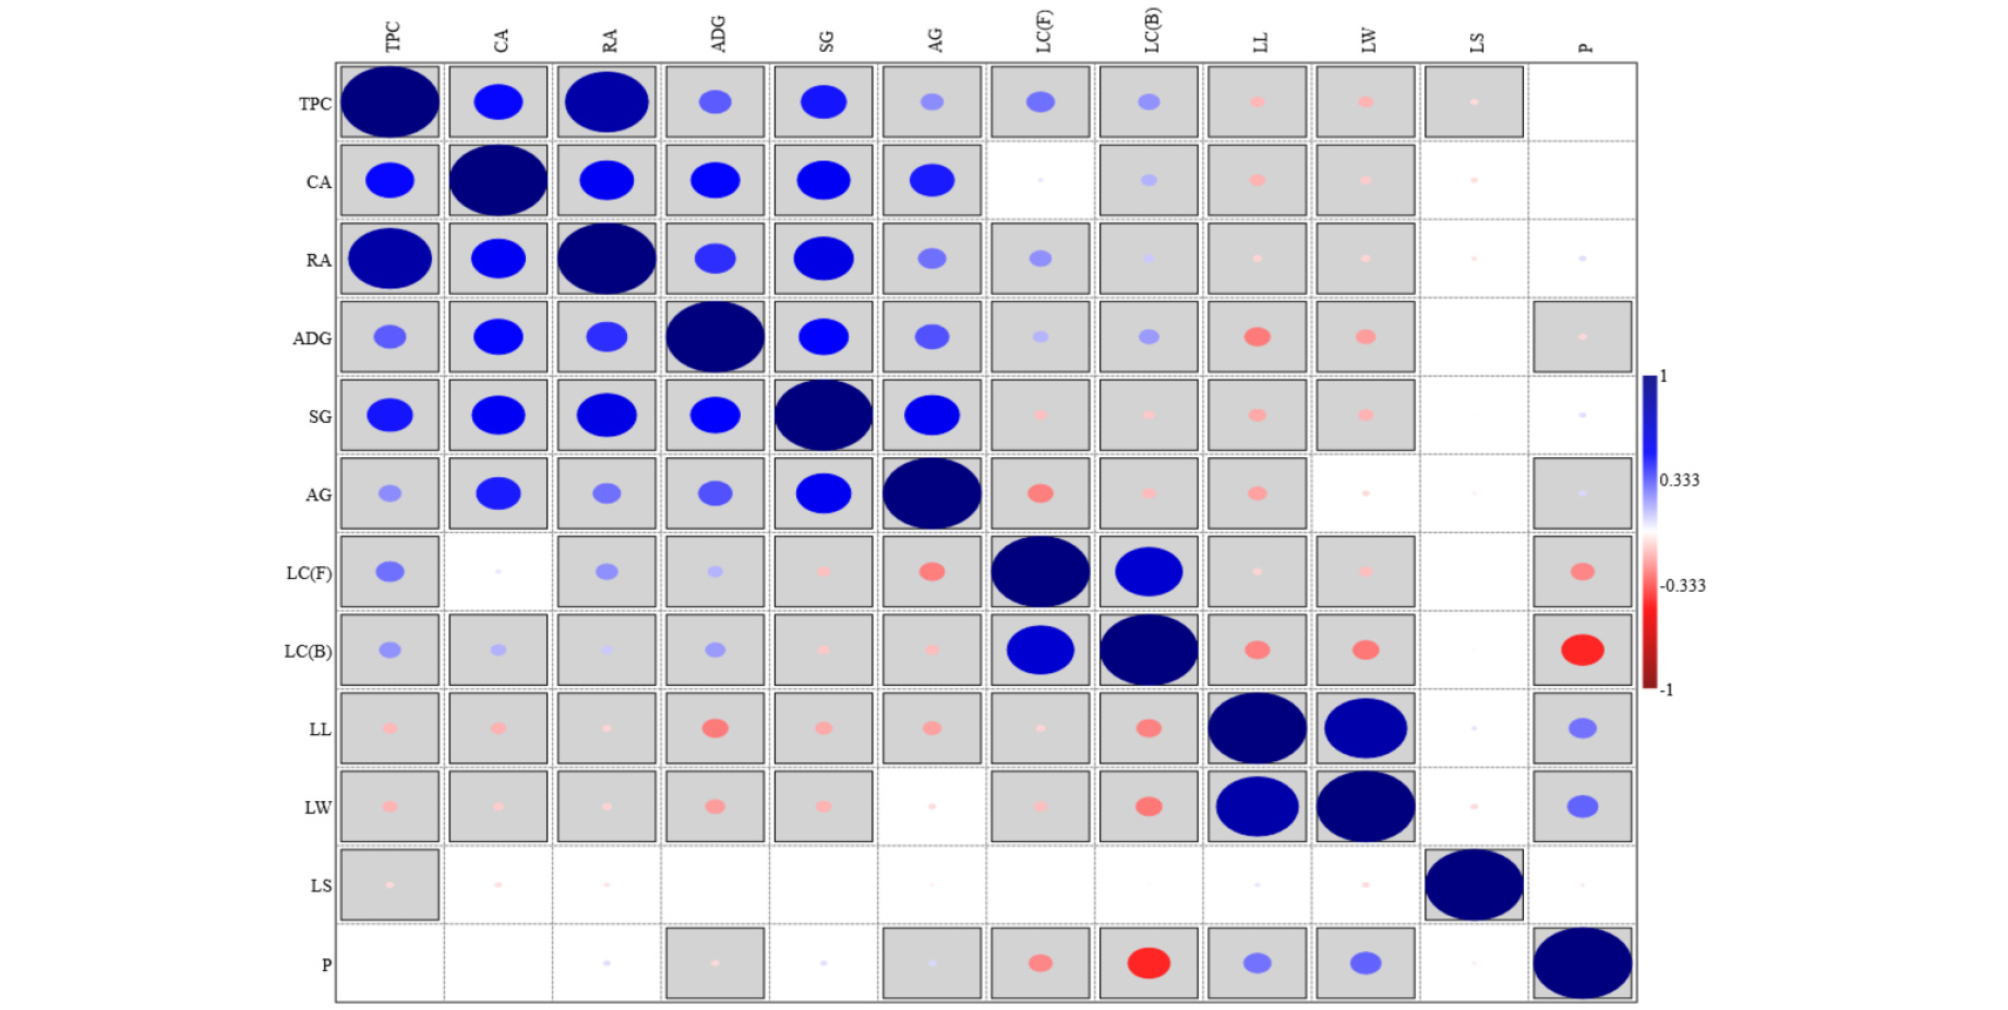
Fig. 3.
Pearson correlation (p < 0.05) of the analyzed discriminants. Unboxed = uncorrelated; Blue positively correlated; Red = negatively correlated. The size of the dot is proportional to the r value (-1 to 1). Levels: Leaf color (LC) levels (Front (F) and Back (B) surface); 1 = Light green; 2 = Green; 3 = Dark green; 4 = Light purple; 5 = Dark purple. Leaf shape (LS) levels: 1 = Cordate; 2 = Ellipse. Pubescence distribution (P) 1= Few; 2 = Normal; 3 = Many.
In this study, we investigated profiles of total phenolic content and prominent phenolic compounds in leaves of 782 perilla germplasm collections obtained from the National Agrobiodiversity Center Gene Bank of South Korea. Some selected quantitative and qualitative morphological characters and their relations with contents of phenolic compounds were also investigated. Total phenolic content ranged from 7.99 to 133.70 (average, 66.07) mg GAE/g DE. RA was the predominant metabolite in 94.5% of accessions, followed by SG (dominant in 4.6% of accessions). RA exhibited a considerable variation among the entire germplasm accessions, ranging from ND to 21.05 (average, 6.79) mg/g DE, while CA content varied from ND to 1.17 mg/g DE. ADG, SG, and AG contents ranged from ND to 2.21, ND to 5.25, and ND to 2.81 mgLUE/g DE, respectively. Positive significant correlations of the intensity of green pigment at abaxial and adaxial leaf surfaces with total phenolic contents and individual phenolic compounds were observed. Leaf length and width was negatively correlated with total phenolic content and contents of individual phenolic compounds. Although purple pigmented accessions were shorter in leaf length and leaf width, they contained higher contents of phenolic compounds than green pigmented accessions in most cases. Number of leaf hair (pubescence distribution) was positively correlated with leaf length and leaf width. There was no significant difference in SG between means of groups of genetic resources based on leaf color, plant type and pubescence distribution. Purple pigmented leaves were associated with low pubescence distribution. Leaf shape was not correlated with content of individual phenolic compounds, color, length, or width of leaves. Thus, contents of total phenolics and individual phenolic compounds along with morphological characters might be useful as distinguishing factors for perilla accessions analyzed.
